A. Bows, bouncing and the centre of percussion
So far, we have talked a lot about bowing but we haven’t actually included a real violin bow in the discussion: the computer simulations have assumed a rigid “bow” acting at a single point on the string. We must now look to see what is different if a conventional violin bow is used in place of a rigid rod.
First, we need to understand the anatomy of bows. A carefully-shaped stick, usually made from a wood called pernambuco, has a cranked tip carved into it. This tip carries one end of the ribbon of bow-hair. The other end is carried by the “frog”, a block of wood (usually) which can slide along the stick, secured by a threaded screw within the stick which can be used to tension the hair. In violin bows of professional standard, the ribbon consists of 150—200 strands of horsehair, in a band approximately 10 mm wide.
The key figure in the development of the modern violin bow was François Tourte, working in France in the late 1780s. Before Tourte, bows for stringed instruments usually had a slight upward curve in the stick. Tourte reversed this, introducing the down-curved stick we see today. You can see a typical modern bow compared to an earlier bow (a treble viol bow) in Fig. 1. Figure 2 shows a close-up of the two bow tips.

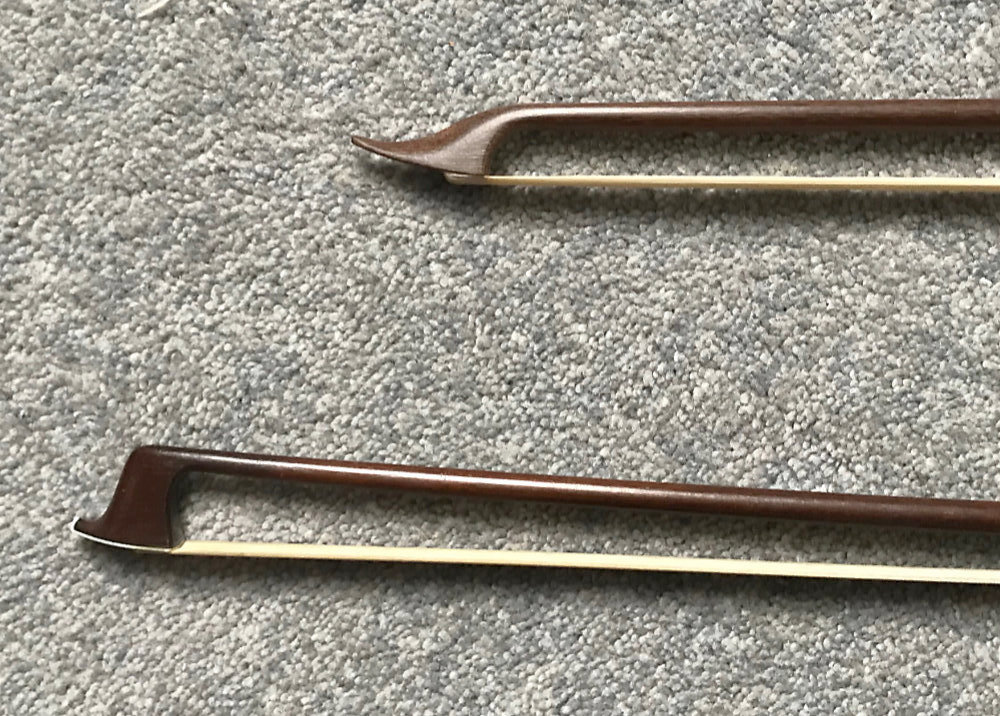
An important consequence of the downward curvature of the bow stick was highlighted by Askenfelt and Guettler [1]: the Tourte form allows significantly higher tension in the bow hair. As the hair is shortened, the tension tends to rotate the tip, and thus bend the stick upwards. If the curvature of the stick is already upwards, this extra curvature tends to make the stick less able to resist the axial force of the hair tension. But the Tourte stick gets straighter, not more curved, as the hair tension is increased within the usual working range.
Players are in no doubt that the bow is an important thing in its own right. They will have definite preferences for particular bows, and they may be prepared to spend a surprisingly large amount of money on a bow: a significant fraction of the value of the instrument itself. The physics behind this influence of the bow has proved quite elusive to understand. Some things are known, but if anything the question of preferences between bows remains even more mysterious than the corresponding question about preferences between violins (or cellos, or whatever). There are several possible ways that the bow can influence the sound and playing “feel” of a violin, and I will group them into three categories for this discussion.
An expert violinist requires their bow to perform all kinds of sophisticated tricks, and my first category of physical attributes of a bow contains things which affect how the bow “feels in the hand”, and which thus contribute to the ease (or otherwise) of performing these tricks. If you hold a violin bow in the normal way, then wave it around in the air in the plane of the bow, elementary mechanics tells us that just three parameters are enough to determine how it will feel and behave. One of them is the total mass, and the other two are determined by how that mass is distributed: the stick is tapered, and it has additional mass near the ends in the form of the frog and the tip.
We could use various possible parameters to characterise this mass distribution, but there are two particular ones that are commonly used by bow-makers. First, and most intuitive, is the balance point (or “centre of mass”). The second parameter is something called the “centre of percussion”, and as well as completing our characterisation of the mass distribution it also relates to an important aspect of performance with a bow. Some kinds of bowing make use of the way the bow can rebound from the string. Examples are the bowing styles known as ricochet, spiccato and sautillé. You can see demonstrations of these, and many other kinds of bowing, in this YouTube video: go to the times 0:20 for ricochet, and 1:51 for spiccato-sautillé.
The definition of the centre of percussion goes like this. Imagine hanging the bow from the point marked “pivot” in Fig. 3: it is the position where the player will usually place their thumb when holding the bow in the normal way for classical music. Now think of tapping the bow-hair with a pencil. If you tap at a position close to the pivot, there will be a reaction force at the pivot, and it will be in the opposite direction to your tap. But if you tapped right at the other end, near the tip, the reaction force would be in the same direction as your tap, because it has to restrain the bow from rotating about somewhere near the middle. Somewhere in between these two tapping positions, there will be one particular place where there is no reaction force at all. This is the “centre of percussion”. It is marked with a green arrow in Fig. 3: it is about 2/3 of the way down the bow from the pivot point. The next link gives some technical details about all this.

Another way to describe the effect would be to think of lying the bow on its side on an ice rink so that it could slide around any way it wanted, and then tapping the hair in a horizontal direction with your pencil. When you tap exactly at the centre of percussion, the bow will start to move by rotating about the “pivot” point, even though there is no pivot present this time. If you tap anywhere else, the “pivot” point will move: in one direction if you are closer to the frog, and in the opposite direction if you are further from the frog.
When a player wants to perform ricochet or spiccato notes, they need the natural bouncing behaviour of the bow to do some of the work for them. This in turn depends on the position of the bowing point along the bow, partly through the influence of the centre of percussion. It seems reasonable that very rapid ricochet playing might be easier if the bowing point is fairly near the centre of percussion, so that the bow naturally wants to rotate around the player’s thumb during the bouncing action. Askenfelt and Guettler did an interesting study of “the perfect spiccato” [2], and they suggest that such strokes are “always played well inside the centre of percussion (about 10 cm)”. For the bow in Fig. 3, that position would lie halfway between the balance point and the centre of percussion. They also point out that such bowing techniques only became possible with the higher hair tension available from a Tourte bow. Viol players do not do such flashy bowings!
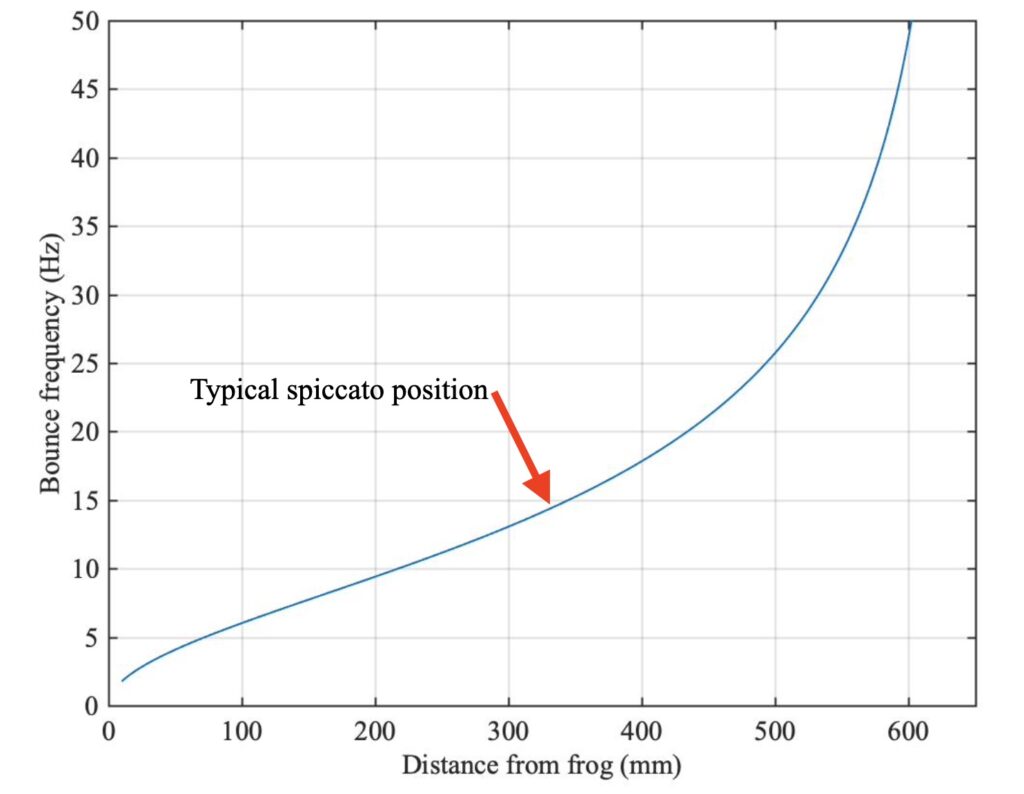
There is another aspect of the dynamics of a bouncing bow that is very important for a player aiming to perform rapid spiccato or ricochet. When the bow is in contact with a string, it has a resonant bouncing frequency determined by the inertia of the bow and a stiffness coming mainly from the bow-hair tension. This resonance frequency varies strongly with position along the bow, and also with bow-hair tension. Askenfelt and Guettler [1] gave a simplified theoretical expression for this: Fig. 4 shows a version of their plot. The next link describes their model. They tested a professional violinist with a wide variety of bows, asking them to play the same rapid spiccato with each one. They found that the player did indeed adjust the hair tension and bowing point for each bow so as to create essentially the same bouncing frequency every time.
B. Finite bow width
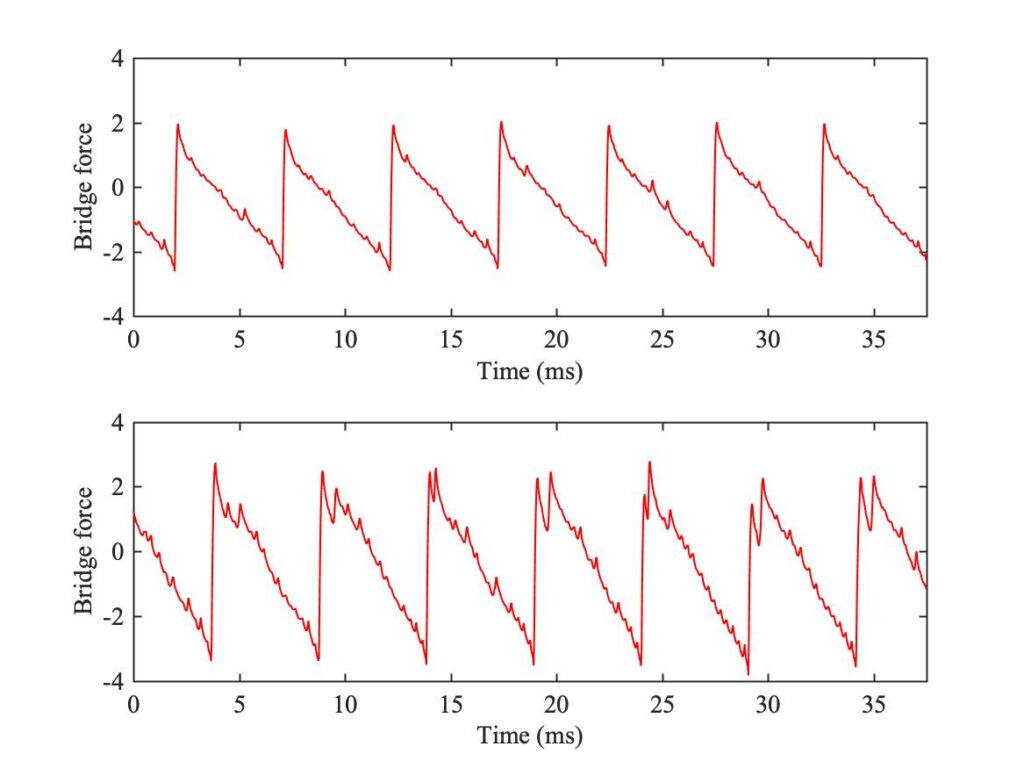
It is time to move on to the second category of physical consequences of using a bow: these are effects directly arising from the finite width of the ribbon of bow-hair. The most important effect is best introduced by an example. Listen to Sound 1: this is a recording using the bridge-force sensor of the open G string of a violin. The player gradually slides the bow towards the bridge, getting very close at the end of the sample. In the sound, you should be able to hear a growth in harshness of the sound, ending with a definite “crunch”. This example is intentionally extreme, but players sometimes make deliberate use of this harsh sound at moderate level.
Figure 5 shows two extracts from this measured waveform, from early and late in the sequence. Both show the familiar Helmholtz sawtooth waveform, but they both have something extra superimposed. The upper trace shown occasional small spikes in the waveform, which differ in detailed placement from cycle to cycle. The lower trace shows a similar thing in more extreme form: it is not surprising that this irregular waveform might sound harsh or noisy.
We get a clue about what might be happening from Fig. 6. The upper diagram shows the moment in an ideal Helmholtz motion when the travelling corner has just gone past the bow, setting off towards the player’s finger. The ribbon of bow-hair is indicated by the yellow stripe: deliberately shown very wide, to make the effect clear. The lower diagram shows what might happen later in the cycle, shortly before the Helmholtz corner gets back to the bow. In the ideal version of Helmholtz motion, the string shape would follow the dotted line. But if the portion of string in contact with the bow has been sticking throughout this time, over the entire width of the bow-hair, the string would need to take up a zig-zag shape more like the solid line.
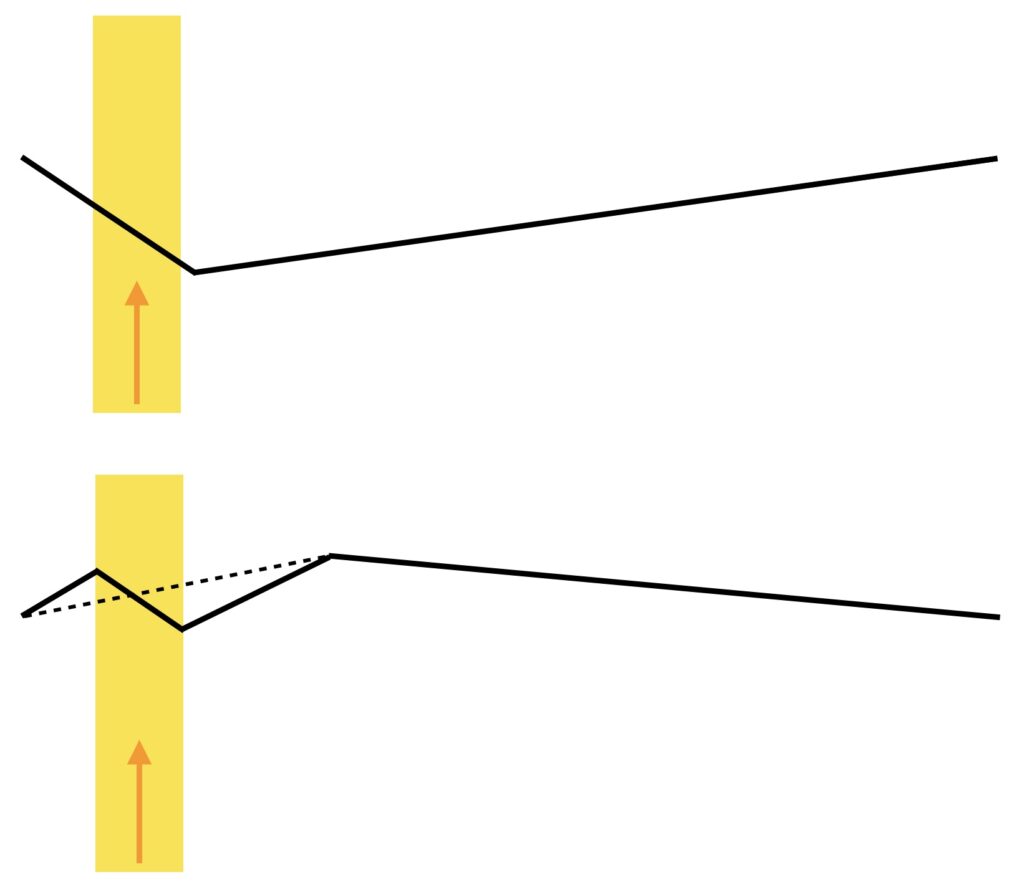
There are sharp corners at the edges of the bow-hair. These produce concentrated forces, in opposite directions on the two edges. This feels physically unrealistic: surely we might expect the string to have slipped in some region near the edges of the bow, before things got this extreme? Those localised slips, at the edge of the bow facing towards the bridge, are responsible for the “spikes” we saw in the bridge-force waveforms of Fig. 5. The effect becomes more extreme when the bow moves closer to the bridge.
We can confirm this idea by extending the computer simulation model to allow for a bow of finite width, using an approach first used by Roland Pitteroff [3, 4]. Models of this kind are by no means as highly developed yet as the single-point models we have used so far, but nevertheless we can get useful qualitative results. Some details are given the next link: we can make versions of the simulation model based round all three of the friction models introduced in section 9.6.
Figure 7 shows one example of such a simulation, for a case approximately matching the results shown in Fig. 5. This particular example was made using the friction-curve model, initialised with ideal Helmholtz motion and then allowed to run for a while for the motion to settle down. The bridge force waveform shows an irregular pattern of spikes superimposed on a more-or-less steady Helmholtz sawtooth, qualitatively similar to the results in Fig. 5.
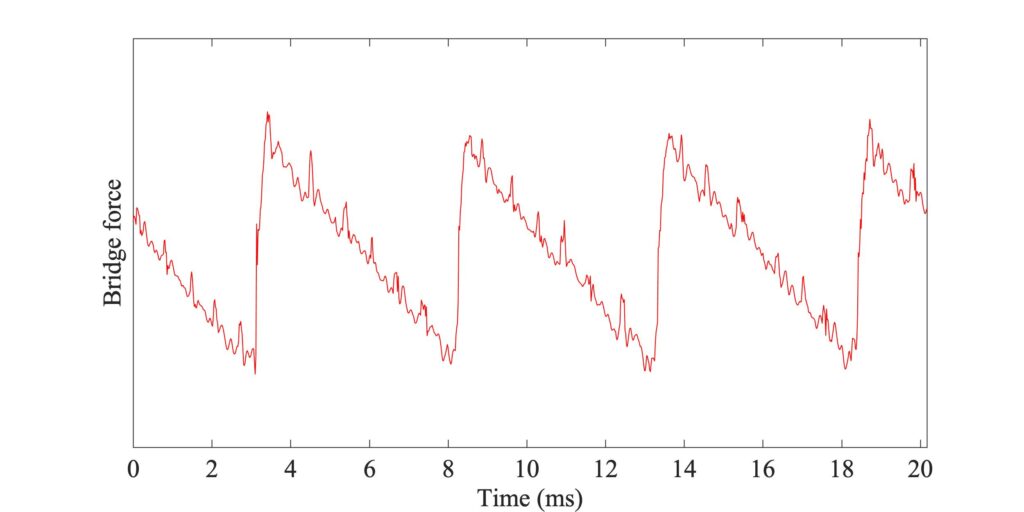
Figure 8 shows the corresponding pattern of sticking and slipping across the width of the bow. The time axis matches Fig. 7, and the top edge of the plot corresponds to the edge of the bow closest to the bridge. Black pixels indicate sticking and white ones indicate slipping. The main Helmholtz slips show up as top-to-bottom white stripes, while the partial slips causing the spikes in Fig. 7 show up as white streaks in the upper part of the plot. There are a small number of red pixels, indicating slipping in the reverse direction: these occur occasionally near the bottom edge of the plot, as Fig. 6 might have led us to expect.

This model allows us to make a preliminary exploration of something important. We have already discussed the effects of several variables a player can control during bowing: the bow force, speed and acceleration, and the position of the bow on the string. But there is one more variable, which we have ignored up to now: players do not necessarily press the bowhair flat against string. Instead they often tilt the bow, so that the distribution of normal force is not uniform across the width. In extreme cases, they may tilt sufficiently that the hairs only contact the string over part of the width.
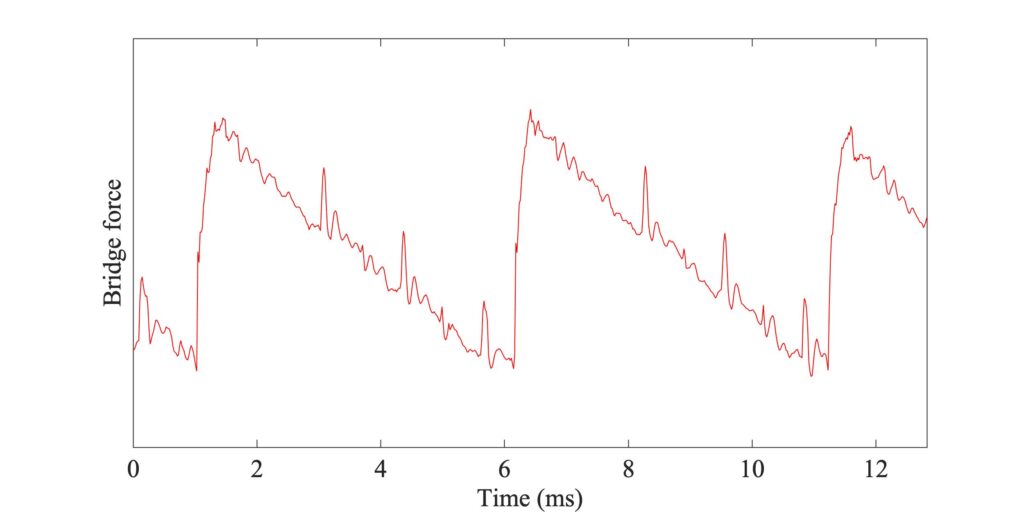
Figures 9, 10 and 11 give an impression of the consequence of a tilted bow. Figure 9 shows a somewhat zoomed view of Figs. 7 and 8, with a flat bow. It shows Helmholtz motion, with some irregular “spikes” in evidence. Figure 10 shows a case in which all parameters are the same, except that the bow has been tilted in the sense that players usually use. The normal bow force varies linearly across the width of the bow, falling to zero at the edge nearest to the bridge and rising to double the mean level at the opposite edge. Figure 11 shows the converse case, with “incorrect” tilting so that the force is higher at the edge nearest to the bridge.
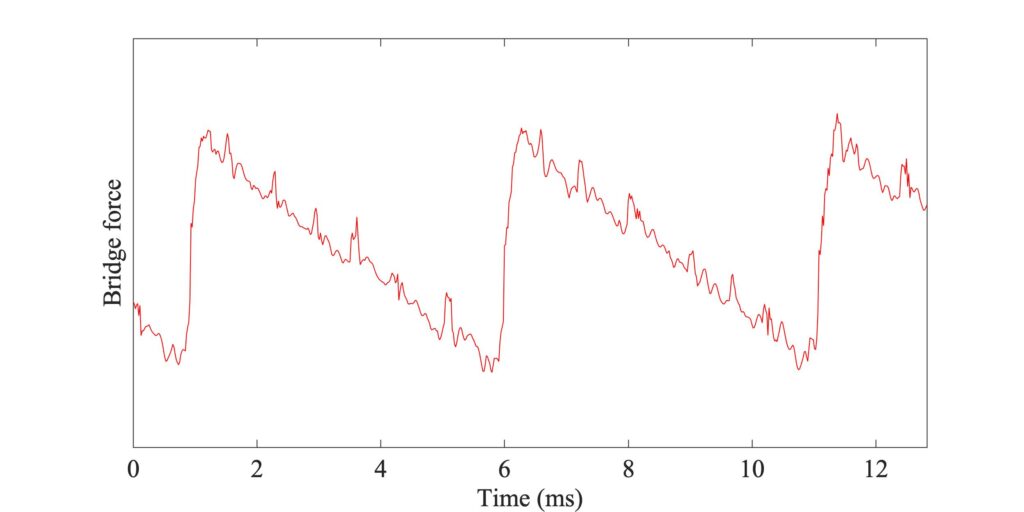

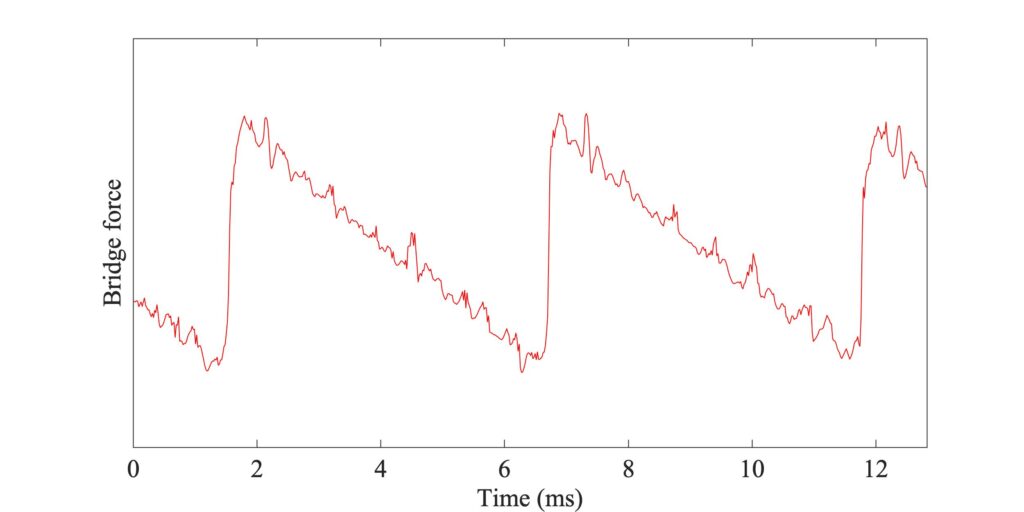


Comparing Figs. 9 and 10, the bridge force waveforms look quite similar, but the stick-slip patterns are significantly different. With the flat bow, the white streaks denoting partial slipping at some of the bow-hairs extend across almost the whole width of the bow. For the tilted case, the edge of the bow nearest to the bridge is slipping for most of the time (occasionally in the reverse direction) but the white streaks do not extend so far across the bow. Instead, there is a somewhat larger region (at the bottom of the stick-slip plot) where the bow is sticking throughout the nominal stick period of the Helmholtz motion. This may give the player an extra sense of security: they can “keep a grip” on the string, with less danger of occasional partial slips reaching right across the bow and producing stronger “spikes” in the bridge force.
Figure 11 shows precisely this danger in action, when the bow is tilted in the opposite direction. There are now a few partial slips in each cycle which reach right across the bow, and the bridge force shows far more marked spikes. It is easy to believe that such a difference would be clearly audible. Unless a player actively wants the “noisy” sound of spikes, they should avoid this kind of “incorrect” bow tilt.
A more extensive collection of simulation examples is given in the previous link. All three friction models are illustrated, and some results are shown from scanning the Schelleng diagram, to see how Helmholtz-like motion varies with bow force and bow position, and with the three different friction models. That link also gives some examples of transient simulations and Guettler diagrams. It is worth showing a selection of Guettler diagrams here, because that gives an opportunity to summarise the state of the art in the simulation of bowed-string transients, wrapping up the discussion developed in sections 9.5 and 9.6.
Figure 12 shows a set of 6 Guettler diagrams. Three of them (in the left-hand column) use finite-width models, based on the three different friction models we discussed in section 9.6. Each of these is compared to a corresponding point-bow model in the right-hand column — these point-bow results are not quite the same as the ones showed in section 9.5, because they are using the parameters for a violin G string rather than a cello D string (for computational reasons explained in the previous link). All cases use the bow position $\beta = 0.0899$ as in earlier figures. The three rows in the plot show different friction models: the friction-curve model in the top row, the original thermal model in the middle row, and the modified thermal model at the bottom. In the previous link, you can see a selection of detailed waveforms associated with all 6 of these plots.
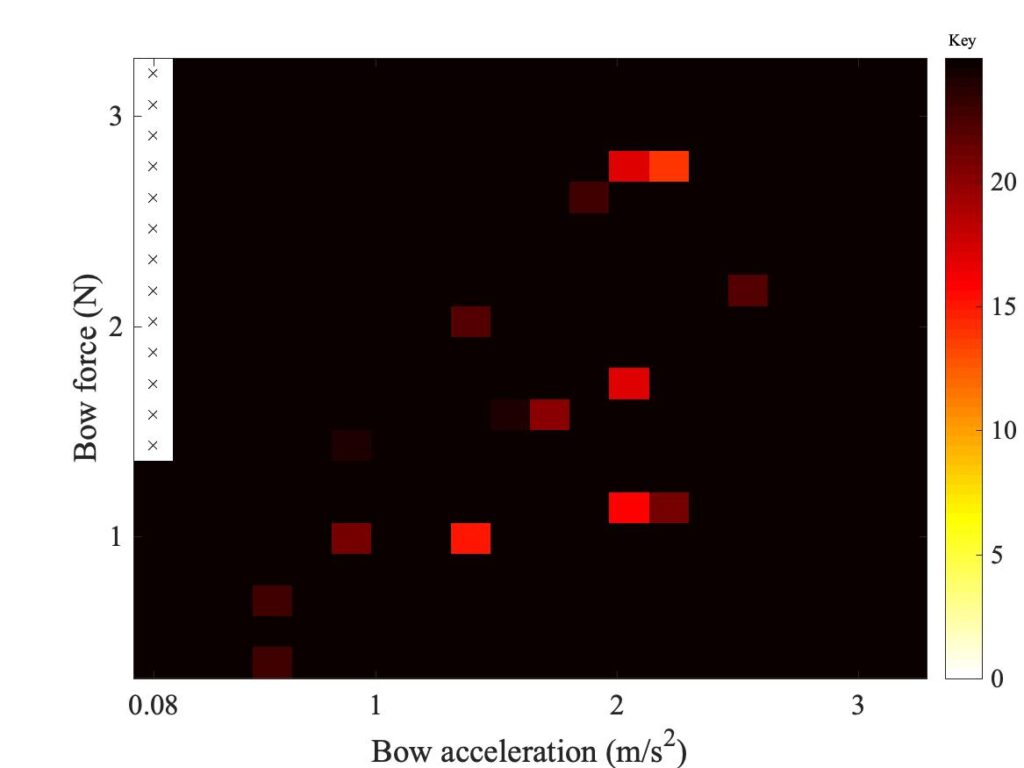
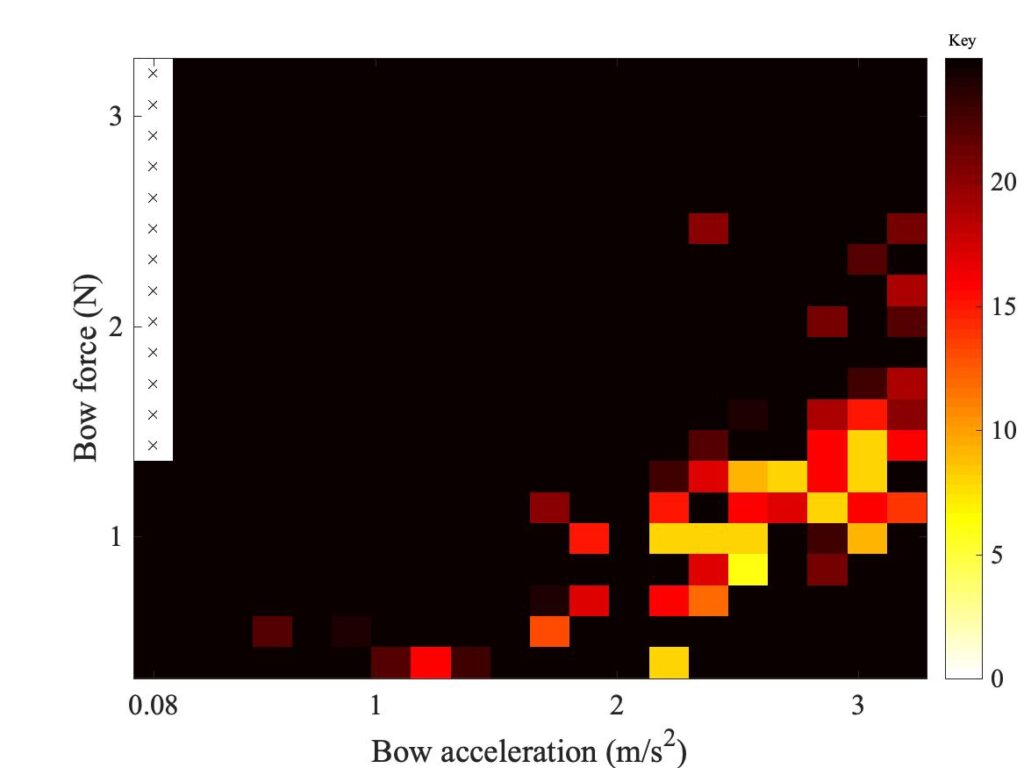
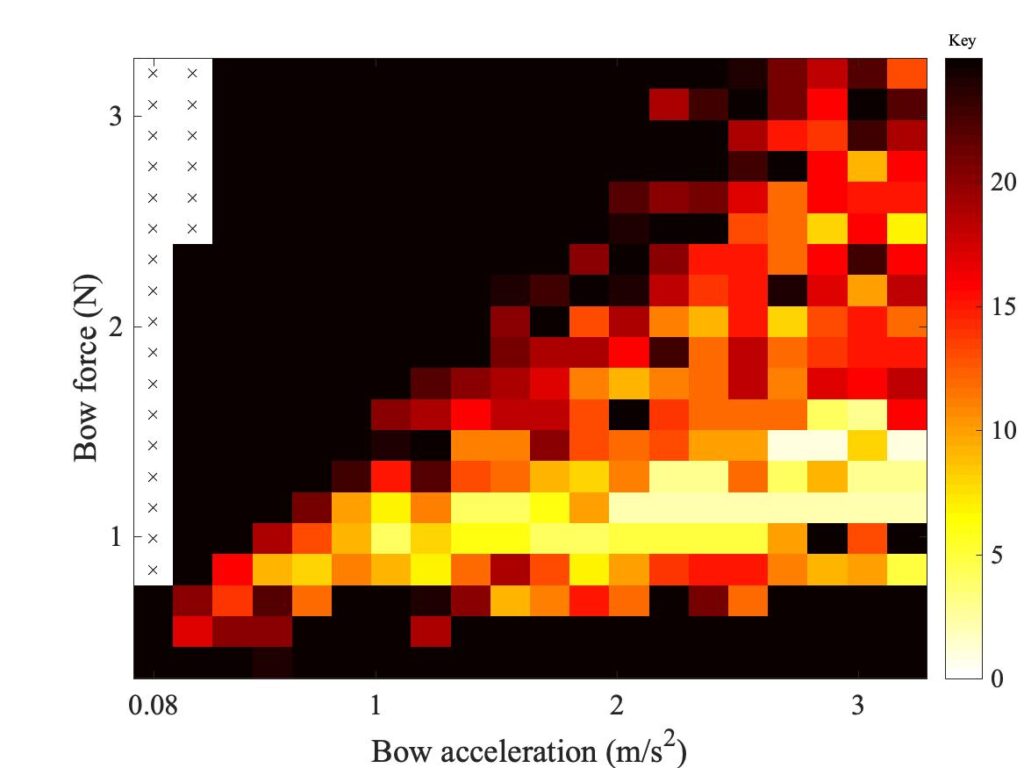
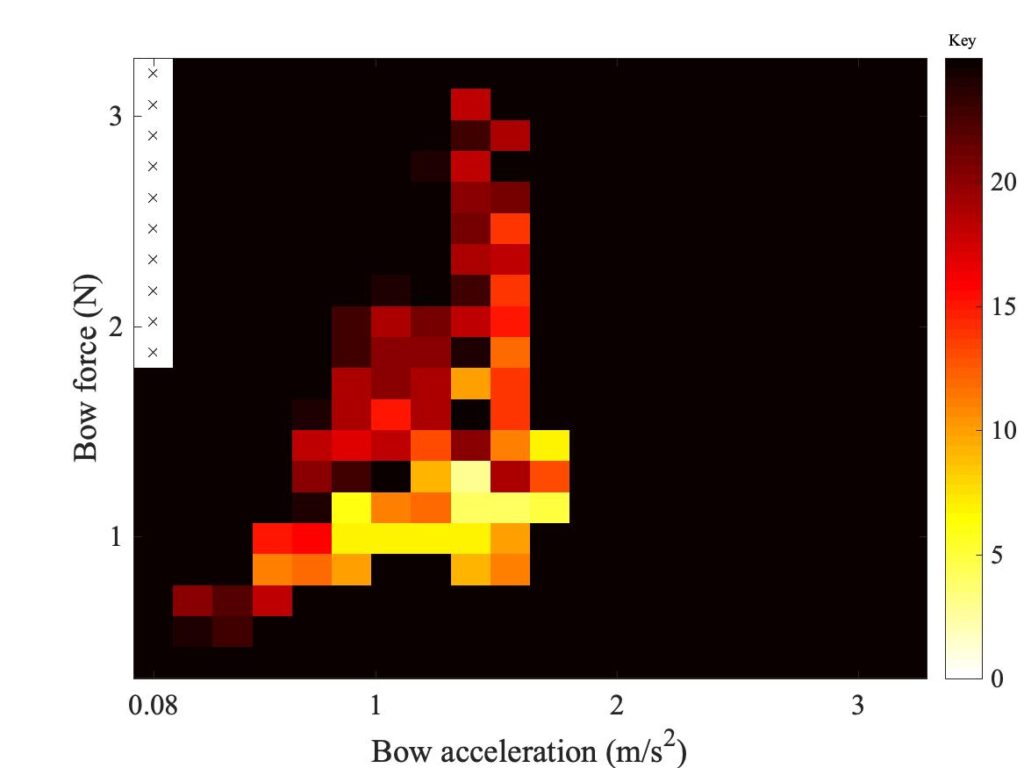
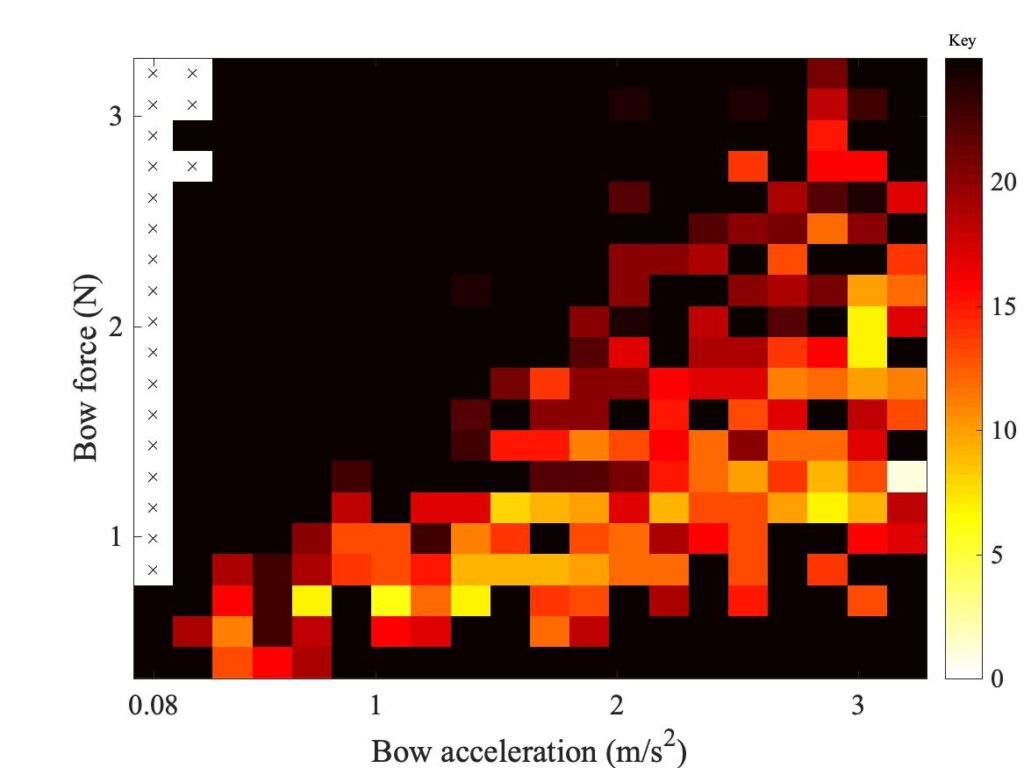
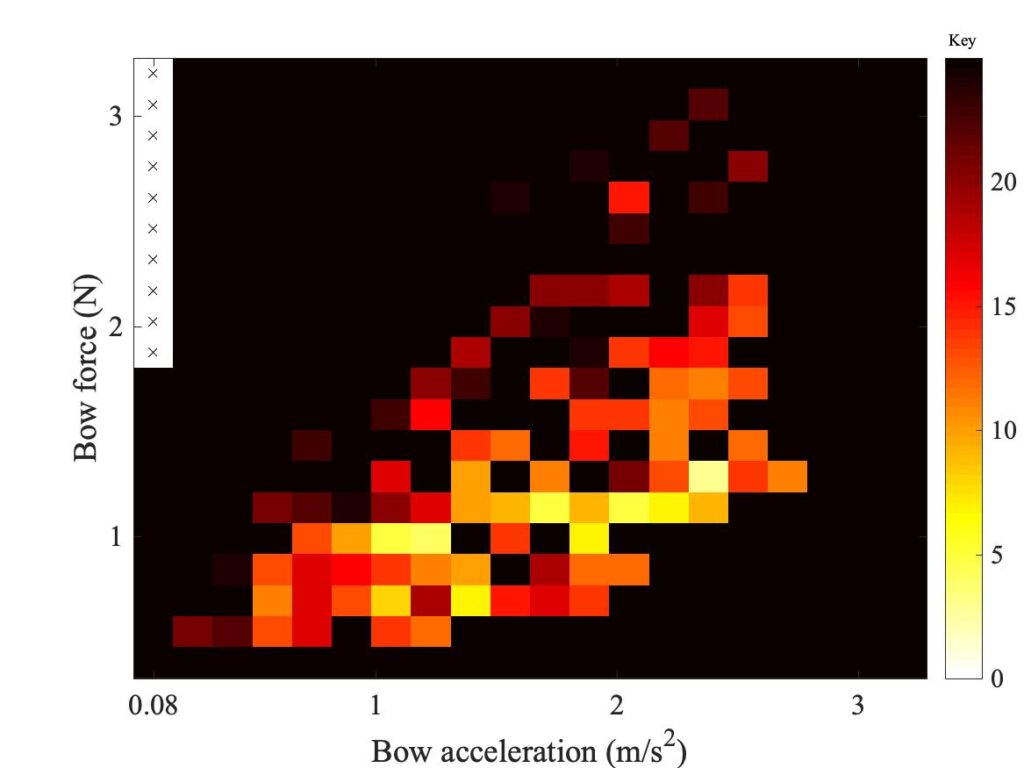
These plots give strong hints of interesting behaviour, even though the study of transient response from finite-bow models is still in its infancy and further development of the models can be expected. Looking first at the right-hand column, we see a pattern similar to the results for the cello D string discussed in section 9.6. The friction-curve model shows relatively few successful transients. The thermal model is somewhat better, except that the points are all concentrated on the left-hand side of the plot. Further to the right, the phenomenon of “rounded bottoms” in the sawtooth waves occurs, as illustrated in the previous section. The modified thermal model does the best, with a good spread of non-black pixels.
The pattern with the finite-width simulations in the left-hand column is rather different. For the friction-curve model, everything gets worse compared to the point-bow model. There are hardly any non-black pixels. The original thermal model, though, behaves impressively well. There is an almost solid wedge of coloured pixels, including some bright colours indicating short transients. The modified thermal model this time seems to make things worse. Although it gives a “Guettler wedge” in roughly the same place as the original thermal model, the colours are less bright and there are more black pixels mixed in.
The resulting picture is tantalising. The results reinforce the message that the friction-curve model gives very poor transient performance, and is not good enough for any serious study of playability issues. The thermal models perform much better, and it looks as if the finite-width model may have eliminated the problem of “rounded bottoms” to give very promising behaviour. The differences between the two versions of the thermal model are relatively slight, so even though neither model is likely to be correct in full physical detail, we are perhaps converging on a model that is fairly robust in the face of changing model details. This gives encouragement for future work using these models to study playability.
C. Vibration of the bow stick and hair
Finally, we turn to the third category of physical effects associated with a bow: things connected with vibration of the bow-stick and bow-hair. Now we enter a world of smoke and mirrors: many players and bow-makers have a deeply-held belief that the bow has a direct influence on the tone of a violin (not just on the ease of performing tricky bowings). But in fact there is at present very little hard evidence for how such an influence on tone might arise.
Of course the stick and hair of a bow can vibrate in various ways: the stick can show bending and twisting behaviour, while the hair is rather similar to a string, and can show transverse and longitudinal vibration. When these things are all coupled together, quite a range of vibration resonances can arise. But a bow, like a string, is very thin compared to the wavelength of sound, so it can make very little radiated sound in its own right. Any influence must, surely, come through interaction with the vibrating string.
One obvious route by which bow vibration might influence the bowed string relies on the cranked shape of a bow-tip (recall Fig. 2). Bending modes of the stick will naturally produce some rotation of this tip, and that will couple to longitudinal motion in the bow hair — bow hair is by no means rigid along its length. The time-varying friction force causing the string vibration is, of course, in the longitudinal direction along the bowhair, so (particularly when bowing near the tip) that friction force will be able to interact with stick vibration. But is this important? The effect would be confined to a frequency band close to each resonance. When players and bow-makers talk about the influence of a bow on the sound, they do not seem to be talking about note-specific effects (rather like the wolf note, discussed in section 9.4).
The physics of bow vibration has been explored in some detail by Colin Gough [5]. Many of the effects have been incorporated into a simulation model for a bowed string by Hossein Mansour [6]. But both authors only make very cautious statements about the possibility of a clear-cut influence of the bow on the sound of a violin. The physical effects they find seem very subtle.
But I don’t want to end this chapter on that negative note. We need to remind ourselves, yet again, that effects which are physically subtle can sometimes turn out to be perceptually significant to a musician. I will show some results about an effect that is not yet fully understood, but which seems to be connected with an aspect of bow vibration. I will put forward a speculative semi-explanation, arrived at in discussion with colleagues and friends Murray and Patsy Campbell.
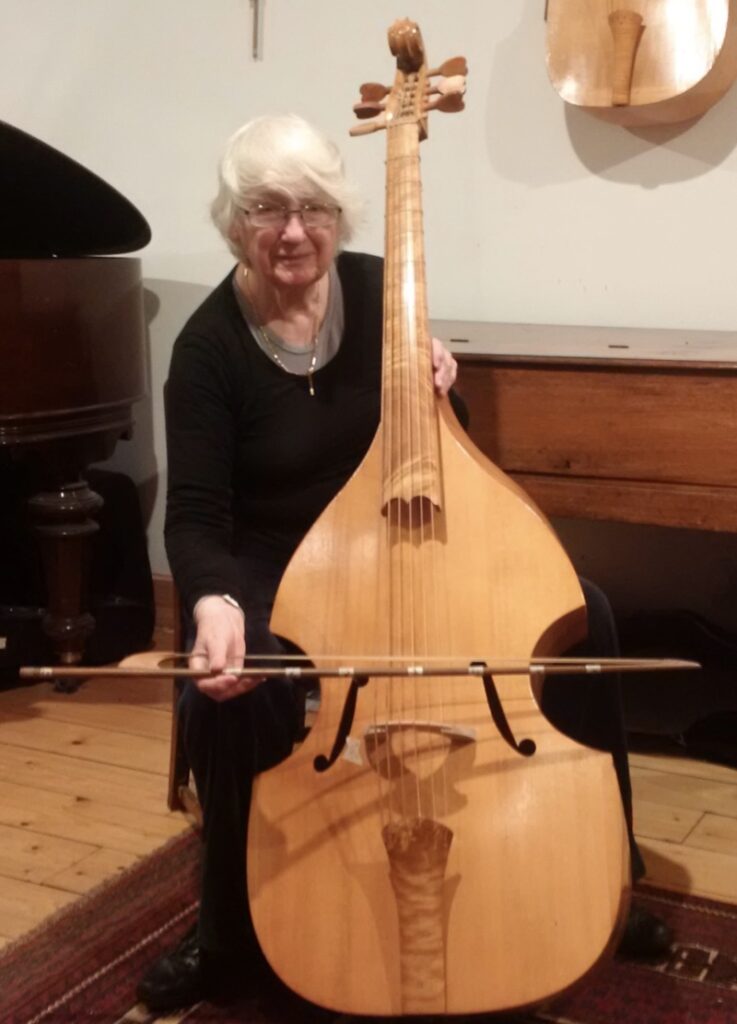
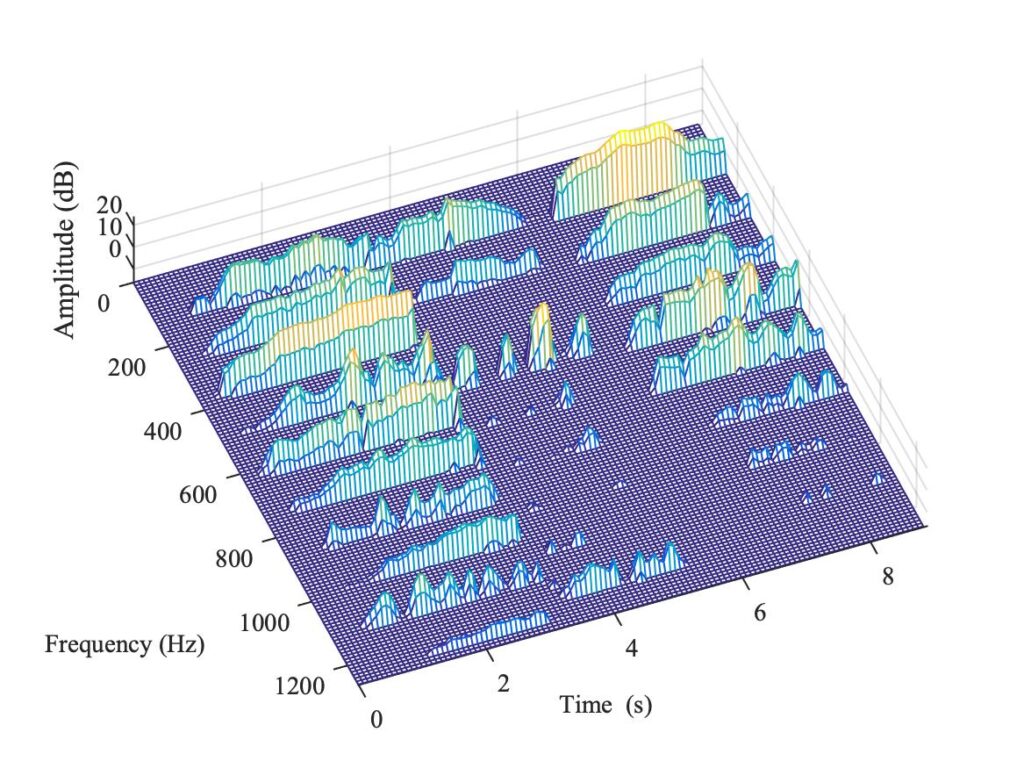
They are both multi-talented musicians, among other things being keen viol players (see Fig. 12). They pointed out a phenomenon that is sometimes heard in viols, and regarded as a nuisance by players. Listen to the three notes in Sound 2: they were all played on the same string of the viol, with nominally steady bow speed and force. In all three, perhaps most prominently in the middle note, you can hear a kind of “wah-wah” effect which we will call “warble”.
The effect is somewhat reminiscent of the cello wolf note, discussed in section 9.4. But the spectrogram shown in Fig. 13 shows that the effect is quite different from a wolf. A classic wolf note normally only affects a single note (near a strong body resonance), and it involves strong modulation in the fundamental frequency component as the Helmholtz motion alternates with double-slipping motion. Neither of those things is true for the viol warble. Figure 13 shows that for all three notes the fundamental, and the second and third harmonics, show little variation in time. The 4th harmonic, though, shows conspicuous and fairly regular modulation in all three notes, most prominently in the middle note. Some of the higher harmonics also show clear periodic modulation, not all with the same rate of repetition.
What is going on? Our tentative explanation involves transverse vibration of the bow-hair ribbon. A first step is to see that such transverse vibration can be excited by bowing, and can have audible consequences. We get rather clear evidence of that from a different test result. The viol bow seen in Fig. 12 was fitted with a small accelerometer, taped to the bow-hair near the frog so as to respond to transverse bow-hair vibration in the plane of the bow. The signal from this accelerometer was recorded simultaneously with two others: the output of a bridge-force sensor of the kind we have seen before, and the sound recorded by a microphone near the instrument body.
A recording was made of a bow change near the frog while bowing an open string on the viol: in other words, an up-bow followed by a down-bow. Figure 14 shows a spectrogram of the response from the accelerometer: you can hear the sound in Sound 3. The spectrogram shows vertical stripes marking the harmonics of the played note, but it also shows a prominent pattern of curving lines dotted out by bright spots on these vertical stripes. These lines mark the fundamental and the first few harmonics of a tone that rises in frequency as the bowed point approaches the frog, then falls again after the bow change. You can hear this rising then falling tone very clearly in Sound 3.
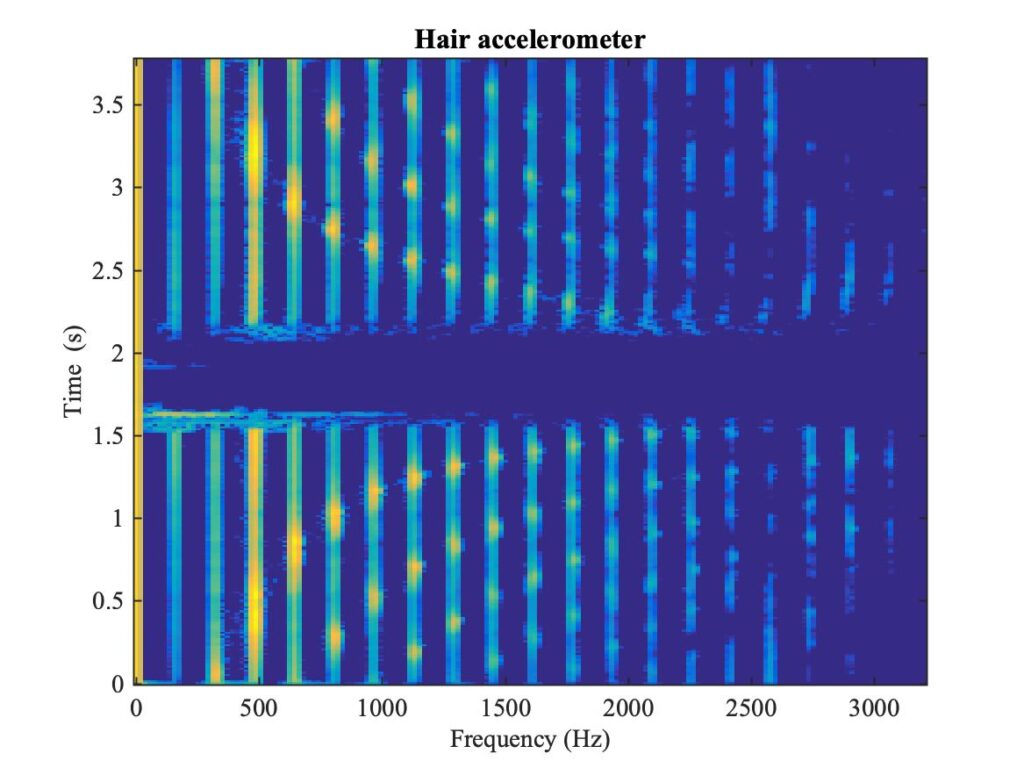
The rising-falling frequency you are hearing corresponds to the lowest resonance of the segment of bow-hair between the string and the frog: that segment gets shorter and then longer during the bow change, producing the rising and falling frequency. The bright spots in the spectrogram show that whenever one of the resonance frequencies of the short segment of bow-hair matches a harmonic of the played note, that bow-hair resonance is strongly excited. If we had placed another accelerometer near the tip, it would have picked up the corresponding vibration of the other segment of bow-hair: this would have produced a sound with the opposite trend, falling and then rising.
The rising-falling tone can be heard fairly clearly in the microphone recording, and seen in a corresponding spectrogram, but there is absolutely no trace of it in the bridge force recording. Putting these facts together, we learn three interesting things, none of them obvious. First, transverse bow-hair vibration is being strongly excited by bowing the string, despite the fact that the time-varying friction force is longitudinal in the bow-hair, approximately perpendicular to that transverse direction. Second, this bow-hair vibration is somehow creating radiated sound that can be picked up by a microphone and heard: but it is not doing this by influencing the usual transverse force at the bridge. Third, the fact that the bridge force seems unaffected suggests that the bow-hair vibration is having little influence on the stick-slip process of string vibration, the thing we have mainly been talking about throughout this chapter.
We can suggest a mechanism to explain the last two of these observations. Transverse vibration of the bow-hair will exert a force on the string at the bowed point, approximately perpendicular to the friction force. This can excite string vibration in that perpendicular direction. But remember that the bright spots in Fig. 14 always occur at harmonics of the played note, which will also be (approximately, at least) resonance frequencies of the string in the perpendicular direction, so this perpendicular string vibration might be quite strong.
Now think what happens at the bridge. The new perpendicular string vibration will not be detected by the bridge force sensor, because that is oriented to capture transverse vibration. But the perpendicular string vibration will exert a force on the bridge in that perpendicular direction, and so it can excite some body vibration (and thus create radiated sound). Possibly, the body response to such perpendicular forcing might be particularly strong in an instrument without a soundpost, as is the case for some of these early-pattern viols.
Returning to the viol warble, that too is not evident in a bridge force recording. This suggests that it might arise through a somewhat similar route, involving transverse vibration of the bow-hair and forcing at the bridge in the perpendicular direction. Support for this idea comes from a detail you can see in Fig. 12: notice that the bow stick has several white markers attached to it. These were empirically placed, to mark positions where the warble effect seemed most prominent. They form a suspiciously regular pattern, which corresponds to the nodal points of the 8th resonance of transverse hair vibration (count the segments between the markers).
Now, a nodal point of a mode of the entire length of bow-hair is also a point where both portions (to the left and right of the string contact) will resonate at the same frequency. So perhaps particularly strong perpendicular string vibration is excited when the bow is near these positions? Does this lie at the heart of the warble phenomenon? We don’t know for sure, yet. This proposed mechanism involves string vibration in two directions and bridge force in two directions, and gathering definitive data to see all those things simultaneously needs another round of instrumentation and data-gathering.
There is one more complication to mention: informal exploration of the warble effect suggests that it happens most strongly if the bow is not perpendicular to the string. Now, string teachers have always told pupils to avoid such “skewed” bowing. At least in the context of viol playing, perhaps avoiding warble is the main physical reason behind that advice?
[1] Anders Askenfelt and Knut Guettler, “The bouncing bow: an experimental study”, Catgut Acoustical Society Journal 3, 6, 3—8 (1998)
[2] Knut Guettler and Anders Askenfelt, “On the kinematics of spiccato and ricochet bowing”, Catgut Acoustical Society Journal 3, 6, 9—15 (1998)
[3] R. Pitteroff and J. Woodhouse, “Mechanics of the contact area between a violin bow and a string. Part II: simulating the bowed string”; Acta Acustica united with Acustica, 84, 744—757 (1998).
[4] R. Pitteroff and J. Woodhouse, “Mechanics of the contact area between a violin bow and a string. Part III: parameter dependence”; Acta Acustica united with Acustica, 84, 929—946 (1998).
[5] Colin E. Gough, “Violin bow vibrations”, Journal of the Acoustical Society of America 131, 4152–4163 (2012).
[6] Hossein Mansour, Jim Woodhouse and Gary P. Scavone, “Enhanced wave-based modelling of musical strings, Part 2 Bowed strings”; Acta Acustica united with Acustica, 102, 1094–1107 (2016).
