To assess the possible significance of side forces exerted by the bridge feet on the violin body, the first step is to measure the tangential admittance at the feet. This is by no means trivial: the method that will be described here is based on an ingenious suggestion by violin maker Joseph Curtin. It is very difficult to apply a tangential force near the surface of the violin body, and also to measure the resulting tangential motion. But if a small $45^\circ$ wedge is stuck to the body at the relevant position, it is relatively simple to tap and to measure the motion normal to the faces, using all combinations. By taking appropriate sum and difference combinations of the resulting transfer functions, it is then possible to estimate the normal admittance, the tangential admittance and the cross term between the two.
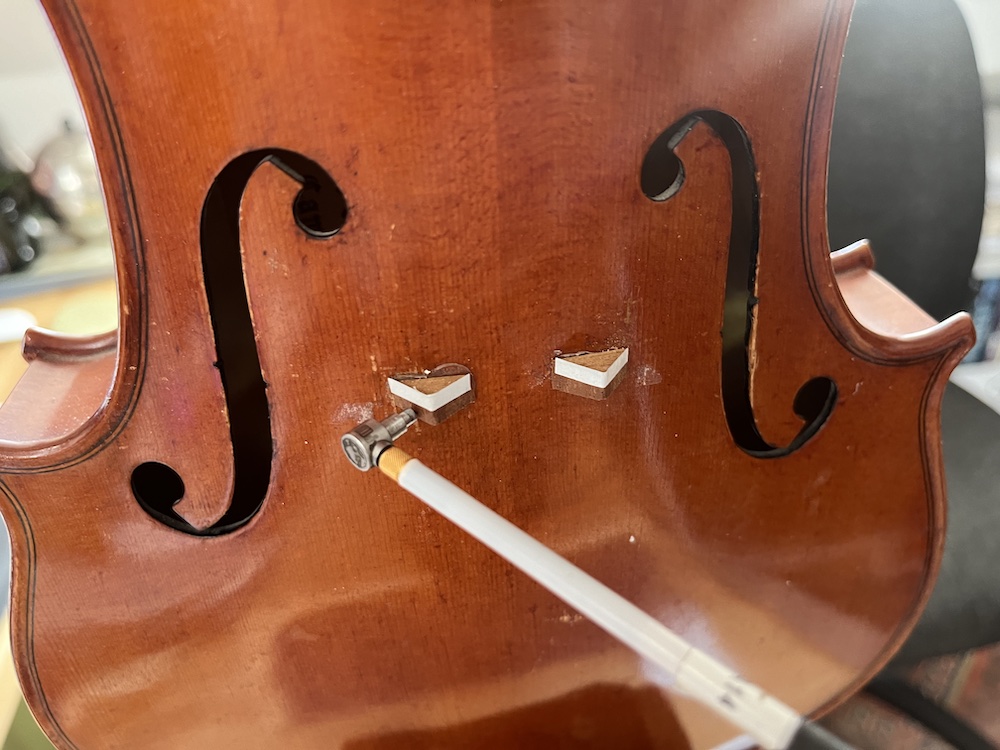
If a single wedge is used, the result is a $ 2\times 2$ matrix of transfer functions. But for a full characterisation, both foot positions should be considered. Figure 1 shows our standard test violin with two wedges attached, allowing the full $4 \times 4$ matrix of transfer functions to be measured. Each wedge is equipped with reflective tape for the laser vibrometer, leaving some bare wood for the impact hammer to tap against. It still requires some ingenuity to make all combinations of the measurements without the hammer getting in the way of the laser beam, but it can be done well enough for an initial evaluation. The wedges are designed to have a similar footprint to the bridge feet, so that any spatial averaging that may result from applying force through those footprints will be reproduced, at least approximately.

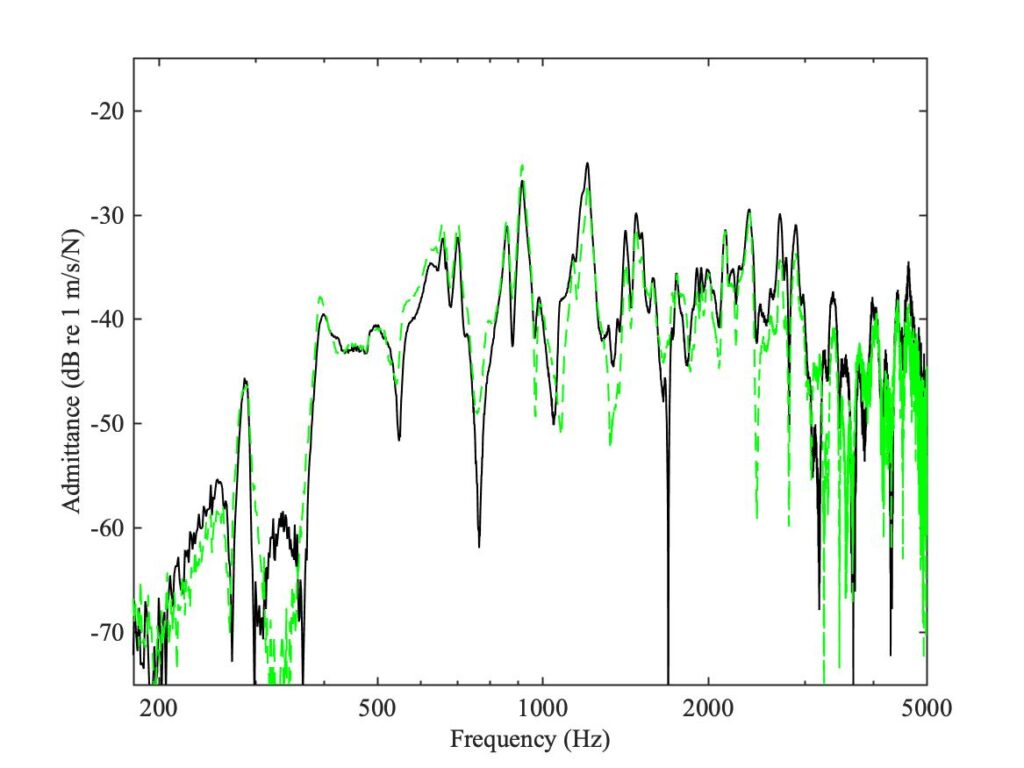
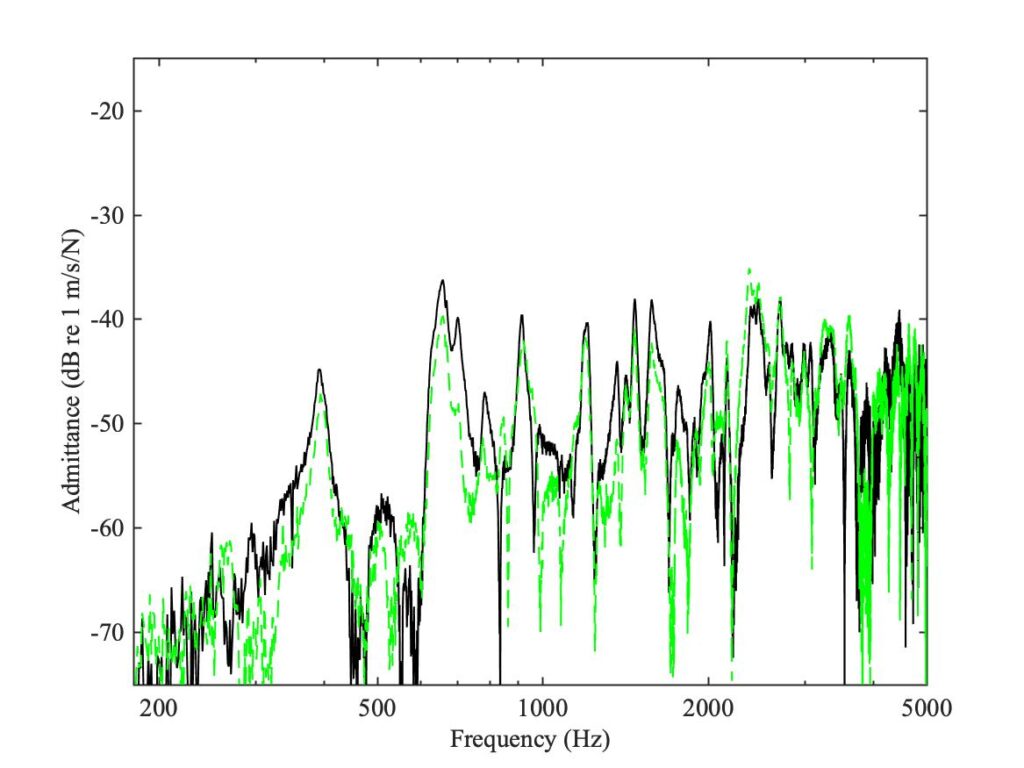
The $4 \times 4$ matrix of raw measurements can be used to generate another $4 \times 4$ matrix, relating the normal and tangential forces at the two feet to the corresponding normal and tangential velocities. As usual, reciprocity requires that this matrix should be symmetric, and this allows checks on the quality of the data. Figures 2—4 show some examples of the results. Figure 2 shows the $2 \times 2$ matrix of admittances at the bass foot, while Fig. 3 shows the corresponding results at the treble foot. Figure 4 shows two examples of reciprocity comparisons from the $4 \times 4$ matrix, so that each curve shows response at one foot to input force applied at the other foot. In all cases, the requirement of reciprocity is satisfied to a reasonable level (each reciprocal pair is plotted in black and dashed green curves).


The red curves in Figs. 2 and 3 both show a systematic rising trend, which has a simple explanation. A side force applied to the surface of a plate or shell can have two effects. Some of the vibration modes may involve significant levels of lateral motion, in the local tangent plane to the shell. Such modes can be excited directly by the side force. But this is not mainly what is being seen in the plots. The side force has another effect, because it acts at the surface of the plate or shell, rather than at the centre.
For simplicity, we will discuss the effect in terms of a flat plate rather than a curved shell. In that case, the modes divide into two classes: in-plane modes (which involve motion that is symmetrical about the middle plane of the plate), and out-of-plane bending modes (which involve motion that is antisymmetric with respect to the middle plane). The side force at the surface can also be decomposed into a symmetric and an antisymmetric combination, as Fig. 5 shows. These can excite modes of the corresponding kinds: the antisymmetric combination is equivalent to a moment (or torque) about the middle plane, which can excite the bending modes.

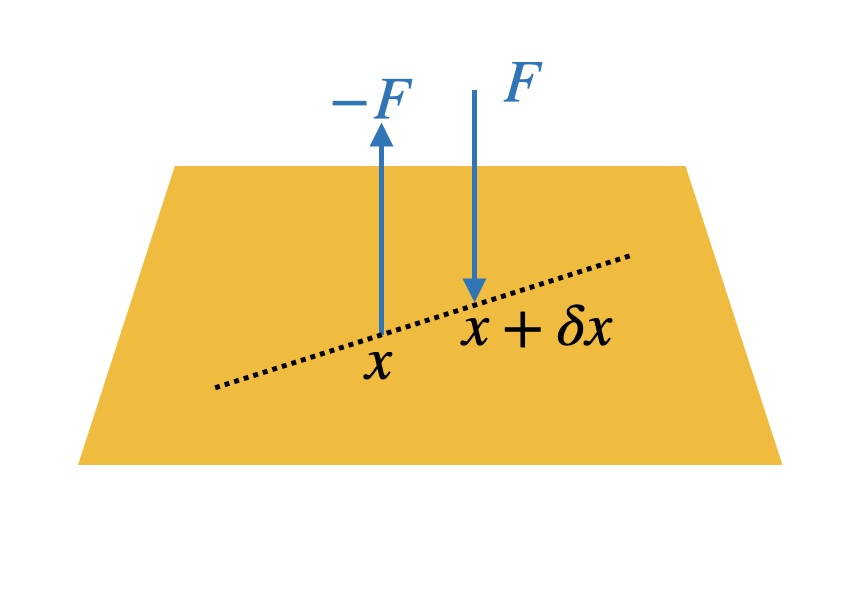
The level of response is then determined by the moment admittance of the plate. There is a simple and general argument that shows how such a moment admittance relates to the more familiar admittance associated with driving the plate with a normal force (for example from an impact hammer). We can think of applying a moment by a pair of equal and opposite forces in the normal direction, rather than in the tangential direction as in Fig. 5. Figure 6 shows a sketch: forces $F$ and $-F$ are applied at two nearby points a distance $\delta x$ apart along a line with distance parameterised by the variable $x$. The moment is defined by $M=F \delta x$. If we shrink $\delta x$ while simultaneously making $F$ larger in such a way as to keep $M$ constant, then in the limit we have the definition of a point moment at the point $x$.

Now suppose that the (normal) admittance to a chosen observation point in response to a force $F$ at point $x$ is written schematically as $Y(x)$ so that the normal velocity at the observation point is $FY(x)$. I have been deliberately vague here: $Y$ could either be a frequency response or it could be a time domain response function, the argument applies equally well to either. The combined effect of the pair of forces is
$$F Y(x + \delta x) – F Y(x) = M \dfrac{Y(x + \delta x) – Y(x)}{\delta x} \rightarrow M \dfrac{\partial Y}{\partial x} . \tag{1}$$
So the moment response is given simply by the partial derivative of the force response, along the relevant direction to suit the orientation of the applied moment.
For the clearest account of how this leads to the rising trend in Figs. 2 and 3, we can make use of results from earlier sections. It is convenient to simplify even further: instead of the relative complexity of a two-dimensional bending plate, we can obtain the main result by considering one-dimensional bending in a beam. Our starting point is the admittance giving the normal velocity at a position along the beam in response to a normal force applied at a chosen point, at frequency $\omega$. Call this admittance $Y(x,y,\omega)$, where $x$ is the forcing position and $y$ is the observation position.
We know from equation (13) of section 2.2.5 that this admittance can be written in terms of the vibration modes of the beam. Suppose that mode $n$ has shape $u_n(x)$ and frequency $\omega_n$: the admittance is then
$$Y(x,y,\omega)=i \omega \sum_n{\dfrac{u_n(x) u_n(y)}{\omega_n^2 -\omega^2}} \tag{2}$$
where the mode shapes are assumed to have been normalised using equation (12) of section 3.2.1, and for simplicity we have considered the undamped case.
If instead of a force at position $x$ we apply a moment $M$, we can use the result proved above to say that the velocity at point $y$ will then be
$$i \omega M \sum_n{\dfrac{u_n^\prime(x) u_n(y)}{\omega_n^2 -\omega^2}} \tag{3}$$
where $u_n^\prime$ is the spatial derivative of the normalised mode shape. But this is not quite what we want, to compare with the red curves in Figs. 2 and 3. The output variable is not the normal velocity at the observation point, it is the tangential velocity on the surface. For ideal bending, this tangential velocity is given simply by the product of the half-thickness of the beam and the rotation angle. The rotation angle is the derivative with respect to $y$ of the displacement, so apart from constant factors, what we need is
$$Y_M(x,y,\omega)\propto i \omega \sum_n{\dfrac{u_n^\prime(x) u_n^\prime(y)}{\omega_n^2 -\omega^2}} . \tag{4}$$
We know from section 3.2.1 that each mode shape of the beam takes the form
$$u_n=C_1 e^{ikx} + C_2 e^{-ikx} + C_3 e^{kx} + C_4 e^{-kx} \tag{5}$$
where $C_1 – C_4$ are constants and the wavenumber $k$ satisfies
$$k^4 = \dfrac{\rho A}{EI}\omega^2 \tag{6}$$
where $\rho$, $E$, $A$ and $I$ are respectively the density, Young’s modulus, cross-sectional area and second moment of area of the beam. So each of the derivatives in equation (4) produces a factor of $k$, and the corresponding term in the admittance $Y_M$ gains a factor $k^2$. But from equation (6), $k^2 \propto \omega$. This is the origin of our trend: the ratio of tangential admittance to normal admittance is predicted to rise proportional to frequency.
This prediction can easily be tested with the experimental data shown earlier. Figure 7 shows the ratio of tangential to normal admittance for the bass foot (in red) and for the treble foot (in blue), using the results from Figs. 2 and 3. The black dashed line shows the predicted trend, proportional to frequency. In broad terms, this line follows the measurements reasonably convincingly.

