
A. The anatomy of the human voice
I am grateful for guidance and support from Sten Ternström, Johan Sundberg and Joe Wolfe in writing this section.
Depending on your point of view, the human voice is either the oldest of musical instruments, or it is not really an “instrument” at all because it doesn’t involve a constructed device of any kind. In any case, singing seems to be a universal human activity: mothers sing to their children, children in turn start to sing from a very young age, and collective singing forms an important part of cultural bonding and ritual in societies across the world and through time.
Humans seem to be driven to make music using anything that can make controllable sounds. Once people discover musical possibilities in an activity, they then make progressive refinements in order to make better music. Singing is a striking example: the gradual refinement process has led to a wide range of specialised singing styles and techniques, from Chinese or western operatic styles to Welsh male voice choirs to Tuva overtone singing to yodelling.
This section will mainly be concerned with human singing, although we will begin with a little bit about normal speaking, and at the end we will have a brief look at the mechanics of birdsong. Humans can make a very wide variety of sounds, which they combine in a rapid and virtuosic manner when talking or singing. For the vast majority of those sounds, the power source is air-flow from the lungs. There are exceptions: when you click your tongue the sound is generated by your tongue slapping against the lining of your mouth, so that the mechanism of sound generation is rather like that of a hand-clap. If you speak a “click language” like some African peoples, such clicks are incorporated in a sophisticated way into speech (see for example https://en.wikipedia.org/wiki/Khoisan_languages).
However, most sounds are driven by the lungs, so that in some sense the human voice is a kind of wind instrument — but it doesn’t fit at all neatly within the classification system for wind instruments that we have been using in this chapter. Figure 1 shows a schematic diagram of the “instrument”, the human vocal tract. Air from the lungs enters at the bottom, passes through the vocal folds (the preferred modern term instead of “vocal cords”), then enters a duct of complicated shape, comprised of the throat, mouth and nasal cavity, before exiting to the outside world through the mouth and nose. For the purpose of this schematic diagram, I have rotated the vocal folds by $90^\circ$: the opening really occurs in the side-to-side orientation, not the front-to-back one shown here. I have also tried to minimise the amount of anatomical detail and jargon in this section, but the next link gives a brief description if you are interested. This link also includes diagrams and photographs showing the true configuration of the vocal folds.

Figure 1 doesn’t really look like any of the wind instruments we have studied so far, but perhaps it comes closest to resembling a brass instrument. The vocal folds behave in a rather similar way to a brass player’s lips, with flaps of squashy flesh being set into vibration by the air flow. The fluctuating pressure produced by that vibration then interacts with a duct with its own resonance frequencies, before emerging to radiate sound into the outside air. So far, so similar to a brass instrument. But there are several very important ways in which the voice is quite different.
First, the shape of the vocal tract is nothing like the shape of any brass instrument we have looked at. Furthermore, that shape is not fixed. The walls of this “duct” are not hard, they consist of soft deformable flesh. Embedded in that flesh are many muscles that allow the owner to actively change several aspects of the shape. The configuration of the vocal folds can be altered, the tongue and the lips can move around, the mouth opening can be varied, and the soft palate can be moved in order to open or close the passage connecting to the nasal cavity. We will see in a moment that rapid reconfiguration of all these things lies at the heart of our ability to speak or sing.
The next important difference from a brass instrument concerns the pitch of a sung note, compared to the length of the vocal tract. A typical male vocal tract is about 17 cm long, whereas a brass instrument capable of producing a similar range of notes, such as the trombone, needs to be far longer: a tenor trombone at full extension is around 2.7 m long. We can immediately deduce that the fundamental frequency of a sung note does not (ordinarily) fall close to a duct resonance. Instead, the sung pitch is normally determined directly by the singer setting the oscillation frequency of the vocal folds. The brass equivalent would be the range of pitches that a player can produce when they “buzz” their lips against a bare mouthpiece, without having the tubing of the instrument attached. Resonances of the vocal tract do play an important role in shaping the sound of speech or singing, though, as we will see shortly.
The next step is to think about what we do to make various sounds, via some simple examples. We will investigate speech first, then move on to singing. Say the word “pay”, and think about what you are doing with your mouth. To make the initial “p” sound you close your lips, build up some air pressure behind them, then open them suddenly to make a small explosion. We will think about the ensuing “ay” sound in a moment: first, we will investigate other ways to start a word, sticking to the same “ay” ending.
Say the word “bay”. You should find that everything is very similar to “pay”, but with a slightly stronger and more emphatic initial “lip explosion”. Now say “day”. This time, you use your tongue rather than your lips to create the explosion, and it comes out sounding a little different. Now say “lay”. Again you use your tongue to create a partial blockage, but this time there is not really an explosion. Instead, you vocalise while you manipulate your tongue – if you want to, you can sustain the “llll” sound for a while, then release the tongue to give the “ay” sound.
Next, say the word “say”. This time, to make the initial “ssss” noise you use the tongue to create a rather narrow opening, then blow some air through it. The turbulence in this air flow makes the “ssss” sound, without any vocalising from your vocal folds. Finally, combine the last two examples by saying the word “slay”. Notice how quickly you have to move your tongue from the “ssss” position to the “llll” position, while switching on vocalisation to make the “llll”. This is a first inkling of the virtuosity involved in normal speaking. You can explore other examples: the words “gay, “hay”, “jay” and “may”, for example, all share the same “ay” ending but require different actions at the start.
Now we can think about sustained sounds. Most of these are associated with vowels (“aaaa”, “oooo” etc.), or combinations of vowels called “diphthongs” (like our “ay” sound from the earlier examples). However, there is also the sound of humming (“mmmm”), or hissing (“ssss”), or whistling. The sounds of vowels or humming involve oscillation of the vocal folds, modulating the air flow from the lungs. Hissing and whistling are different: we have already mentioned hissing, while the sound of whistling is generated by the periodic production of vortex rings (a bit like smoke rings) when air is blown or sucked through rounded lips, at a frequency governed by a Helmholtz resonance in the mouth cavity. This sound doesn’t play a role in normal English speech or singing, so we won’t dwell on it.
You can get a first idea of how you create different vowel sounds by trying a few more simple examples. Say the words “bah”, “be”, “boo” and “bore”. Say them slowly, with the vowel sounds continuing while you think about what you are doing with your lips and tongue. These words all start with the same “lip explosion”, but to make the different vowel sounds you shape your mouth in four different ways. These different shapes create different resonance frequencies of your vocal tract, and this is the key to the perceptual effects of the different vowels. Finally, go back to the word “bay”: to make the diphthong sound “ay” you have to move your mouth and tongue rather quickly between the first part of the sound and the second part.
B. The source-filter model and vowels
We can get a good understanding of how vowel sounds are associated with particular sets of vocal tract resonances by using a simple argument called a source-filter model. First, look at Fig. 2, which shows the configuration of the vocal tract when a typical vowel is being sung. The nasal cavity has been blocked by a movement of the soft palate. (You can convince yourself that this happens by singing any vowel, then pinching your nose shut . Very little changes, because the nasal cavity is not directly connected to the mouth and lungs — but if you pinch your nose while humming, it stops the sound.) When the vowel is sung at a particular pitch, the vocal folds open and close at the frequency of the note, much like a brass-player’s lips. They are shown in the figure at a moment when they are closed.

If we were to model this system by the same approach that we used for brass instruments, we would use a procedure that is summarised in the upper plot of Fig. 3. There is a feedback loop: the varying flow rate through the vocal folds excites the resonances of the vocal tract, and the resulting pressure variation acts back on the vocal folds. The particular waveforms of flow rate and pressure are determined in a rather complicated way by this feedback process.


But we have already noted that the pitch of a sung note is not much influenced by the vocal tract resonances (because the tract is short, so they are too high in frequency). Instead, the pitch seems to be determined mainly by a resonance frequency of the vocal folds themselves, as set by the singer through their muscular action. This suggests that, at least for a preliminary understanding, we might get away with forgetting about the feedback and using the simplified procedure summarised in the lower plot of Fig. 3.
This is the source-filter model: we treat the two stages of the process entirely separately. First, steady air-flow from the lungs causes the vocal folds to vibrate, giving a waveform of volume flow rate past the vocal folds rather like that shown in Fig. 4. For part of each cycle the folds are closed so that there is no flow, then they open to let a pulse of flow through. The example shown here is artificially generated using a formula suggested by Titze [1], chosen to give a reasonable representation of earlier measurements.

The second stage is to take this flow waveform and use it as input to a suitable frequency response function describing the acoustics of the vocal tract, with pressure at the mouth as the output. If the vocal tract had been a simple cylindrical pipe, we would have known what this frequency response needed to be — we already looked at this case, back in section 4.2. Figure 5 reproduces Fig. 12 from that section, showing the first few mode shapes. Each shape consists of a number of quarter-cycles of a sine wave, with a pressure antinode at the closed end (corresponding to the vocal folds) and a node at the open end (corresponding to the singer’s mouth). The lowest mode has no nodal points within the pipe, the second mode has one node, the third mode has two nodes, and so on in an orderly sequence.

Of course, the real vocal tract has a more complicated shape, as indicated schematically in Fig. 2. If we imagine morphing the cylindrical pipe gradually into the correct shape, the mode shapes will change gradually — but the qualitative features of those shapes will remain the same. The lowest mode will have no internal nodal points, the second mode will have one, and so on. Similarly, the resonance frequencies will all change during the morphing process, but (because the length of the pipe/tract remains the same) the average spacing of those frequencies will remain pretty much the same.
Figure 6 shows some measured results for vocal tract resonance frequencies, taken from Ladefoged and Johnson [2]. But there isn’t a single set of frequencies, because the singer can shape their vocal tract in many different ways by moving the tongue and changing the mouth opening. And, of course, this is exactly what we noticed earlier when we spoke or sung the different vowels of the words “bah”, “be”, “boo” and “bore”. The three sets of measured resonance frequencies shown in different colours in Fig. 6 correspond to the vowel sounds in the words “hard” (in red), “food” (in blue) and “bed” (in green). The vertical dashed lines indicate the frequencies for the cylindrical pipe of Fig. 5, with the length of a typical male vocal tract. You can see that the pattern is as we expected: the individual frequencies move around, but the average spacing stays more or less the same so that there are always three in this frequency range.

Plausible approximations to the frequency response functions for these three vowels are shown in Fig. 7. They are only “plausible”, because of a fundamental problem with studying the physics behind the human voice: no-one has yet found an acceptable way to measure this kind of frequency response in a healthy person. A measurement equivalent to measuring the input impedance of a wind instrument (see section 10.4.1) would involve inserting a controllable source of acoustic volume flow deep in the throat, at the position of the vocal folds (without obstructing the vocal tract or preventing the subject from speaking or singing). This would surely require some kind of surgery. The only direct acoustical measurements of the vocal tract have been made at the mouth (see for example reference [3]). Those measurements can tell us the frequencies and Q-factors of vocal tract resonances, but they cannot tell us the modal amplitudes at the vocal folds, which we would need in order reconstruct frequency response functions like Fig. 7 accurately.
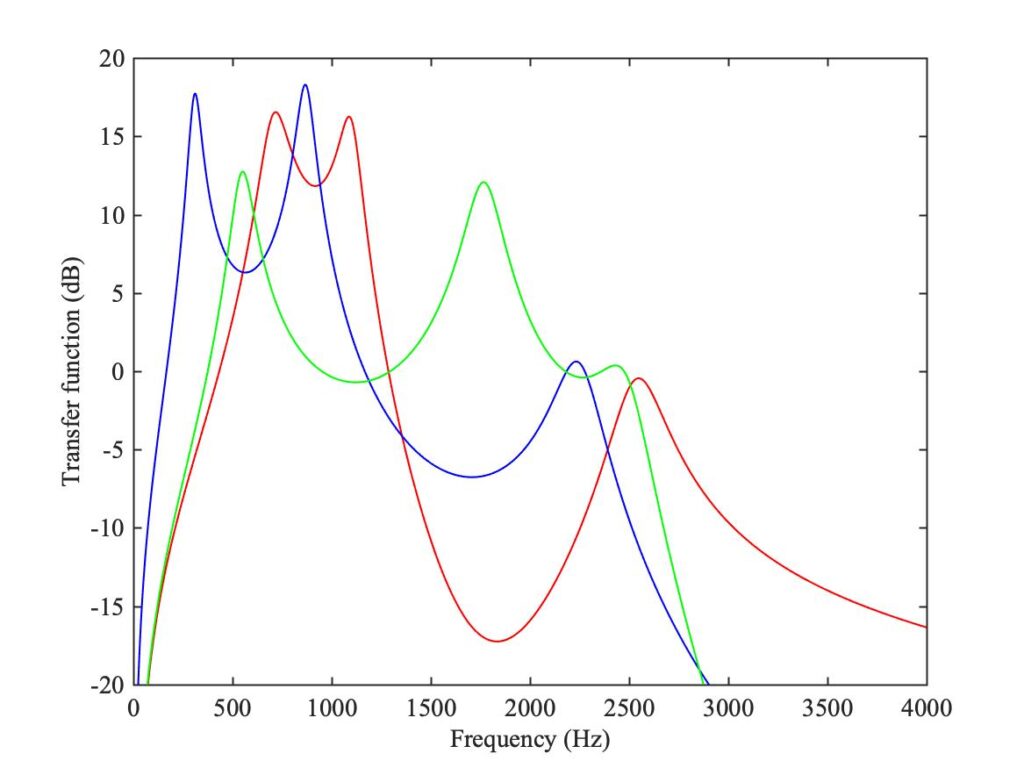
Armed with the approximate frequency response functions from Fig. 7, we are now ready to synthesise some example sounds with the source-filter model. An input waveform based on Fig. 4 was constructed, consisting of 1 s bursts of three different pitches. This input waveform, exactly the same in each case, was filtered by the three frequency response functions from Fig. 7. The result is in Sound 1: you should hear one vowel “sung” at three pitches, followed by a different vowel at the three pitches, followed by a third. You should listen out for two things. First, does each of the three pitches sound like the same vowel? Second, do the three different frequency response functions lead to sounds that are at least somewhat recognisable as the three target vowels (“hard”, “food” and “bed”)?
The next link gives some details of how all the ingredients of this synthesis were done. I should emphasise that the aim here was to produce the simplest synthesis that could demonstrate the vowel effect clearly. It would no doubt have been possible to add more “bells and whistles” to give a more realistic, human-sounding result, but that would have been to address a different question.
If you would like to explore the link between vocal tract shape and vowel sounds some more, there are several excellent resources available online. The most directly available is a web site called Pink Trombone. This is an interactive model allowing you to emulate a wide variety of speech and singing sounds. I suggest you switch off “Pitch wobble”, then play around with the controls. You can alter the sung pitch, you can move the tongue, and by clicking in various places around the mouth opening you can make different articulatory sounds like “p”, “b”, “l”, “m” and so on.
Two other free resources take the form of Windows executables. The program “Madde” available here allows you to construct a wide variety of steady sung notes, including some that sound remarkably like realistic human singing. The program “VocalTractLab” available here is a full articulatory model, like Pink Trombone but more sophisticated.
C. High notes, intelligibility and resonance tracking
Our ability to distinguish different vowel sounds largely independently of the pitch of a sung note depends on the interaction between the harmonics of the note and the frequency response of the vocal tract. We have already touched on this issue, back in section 5.3. Figure 8 is a repeat of Fig. 6 from that section, and it illustrates schematically what is going on. The red lines in the animation indicate the harmonic amplitudes and frequencies, as a chromatic scale is sung. The dashed curve shows a frequency response with two broad resonances, qualitatively similar to those of the vocal tract. This curve is “sampled” by the harmonics, and provided these are sufficiently dense, the pattern of their amplitudes gives an indication of the positions of the resonant peaks. This remains true as the note changes as it moves up the scale — this illustrates the phenomenon of formants.
Figure 8 deliberately made use of rather low frequencies, so that the harmonics are sufficiently close together that the formant pattern can be seen. But you may have spotted that something will go wrong if a very high note is sung. Suppose the fundamental frequency of the note had been 750 Hz, with harmonics at 1500 Hz, 2250 Hz and 3000 Hz. Look where those frequencies fall on the dashed curve — neither resonance would come through clearly as a peak in the sound spectrum, these frequencies are simply too far apart to resolve the structure of the frequency response.
This gives a problem for sopranos, and also leads to an opportunity. It is indeed the case that different vowels cannot be clearly distinguished when sung at very high pitch. This is not the fault of the singer, it is an inevitable consequence of the laws of physics, and composers and conductors need to be aware of it.
But an opera singer is in the business of making enough sound to be heard clearly, and it would seem a pity to let a good resonance go to waste if they are singing a note with a fundamental lying above the first formant frequency for the vowel in question. So, as you might perhaps guess, a trained singer will adjust their vocal tract for very high-pitched notes in an effort to match the first vocal tract resonance to the fundamental frequency. The effect is illustrated very clearly in Fig. 9, reproduced from Joliveau, Smith and Wolfe [3]. Eight experienced sopranos were asked to sing the words “hard”, “who’d”, “hoard” and “heard” at a range of pitches, to give four different vowel sounds. Simultaneously, the authors used their ingenious method for non-invasive measurement of the vocal tract frequency response at the mouth, so that they could pin down the first vocal tract resonance frequency (labelled “$R1$” in the plot) associated with each sung note.

The result of plotting this frequency against the fundamental frequency of the note is shown in Fig. 9. The sloping dashed line indicates where these two frequencies would become equal. At relatively low pitches, the four vowels are clearly separated to mark out four approximately horizontal lines in the plot. The singers are using the usual vocal tract configuration for each vowel to produce four different resonance frequencies $R1$. But as each of the lines in turn approaches the dashed line, it curves upwards and tracks the dashed line. Or at least, it tracks it until the extreme right-hand side of the plot, where perhaps it becomes physically challenging for the singer to shape their mouth to give such a high resonance while still able to sing the note.
In later work from the same research group, Garnier, Henrich, Smith and Wolfe [4] demonstrated a further twist to this story. It turns out that some sopranos learn to tune the second vocal tract resonance to the fundamental frequency of very high notes, and in that way to extend their range of notes that can be sung with strong tone. But in order to achieve this, they have to do something counter-intuitive when they make the transition from first to second resonance: the mouth has to be closed somewhat, whereas the tuning of the first resonance frequency requires the mouth to be progressively opened as the pitch rises.
Perhaps the most striking manifestation of vocal tract tuning is given by overtone singing. This is a technique practised by peoples around the world: a well-known example is Tuvan or Mongolian throat singing. On the principle of a picture being worth a thousand words (and a video worth even more), before I describe the phenomenon watch this short clip of singer Anna-Maria Hefele demonstrating inside an MRI scanner.
Your immediate impression may be that she is able to sing two tunes at the same time: one at very low pitch, the other at high pitch. That is true, but she did not have a free choice of which notes could be produced simultaneously. The high note is always an exact harmonic of the low note, but for a given low note she is able to pick out and emphasise different harmonics by adjusting a vocal tract resonance, mainly by what she does with her tongue. So with a single low note she can emphasise a bugle-like sequence of harmonics, while to produce other high notes she has to vary the low note appropriately.
D. The singer’s formant
Opera singers have another problem with making themselves heard: they are often competing with the sound of a full orchestra. Figure 10 shows typical averaged sound spectra, taken from the work of Johan Sundberg [5]. It reveals that an orchestra alone (black solid curve) has a very similar distribution of sound energy across the frequency range to a normal speaking voice (dashed curve). It follows that a speaker could easily be masked by the orchestral sound.

However, an orchestra with a trained singer soloist (in this case the late Jussi Björling) gave the spectrum plotted in red. In a range around 2–3 kHz, the red curve rises well above the black curve. This boosted level in a well-defined bandwidth is known as the singer’s formant, and it allows the soloist to be heard despite the orchestral “background noise”. It also gives the voice a characteristic tone quality, which accounts for a large part of what it means to “sound like an opera singer”.
The precise details of the physics behind the singer’s formant have been a matter of some debate. Experiments with ducts made to mimic the vocal tract profile inferred from MRI scans of singers led Sundberg to conclude that this formant is not caused by a single resonance but by a cluster of resonances [6]. The singer does something to the configuration of their vocal tract that causes the 3rd, 4th and 5th resonances to shift so that they are close together, in the vicinity of 3 kHz, rather than being more uniformly spaced out as Fig. 6 suggested. This clustering can persist independently of which vowel is sung, so that the beneficial effect of the singer’s formant also persists. Possibly the singer is also able to influence the detailed waveform of air flow through the vocal folds, to increase its high-frequency content and thus contribute to the effectiveness of the singer’s formant. A brief description of at least some of what a singer is believed to do in order to create the singer’s formant is included in the first side link above, section 11.9.1.
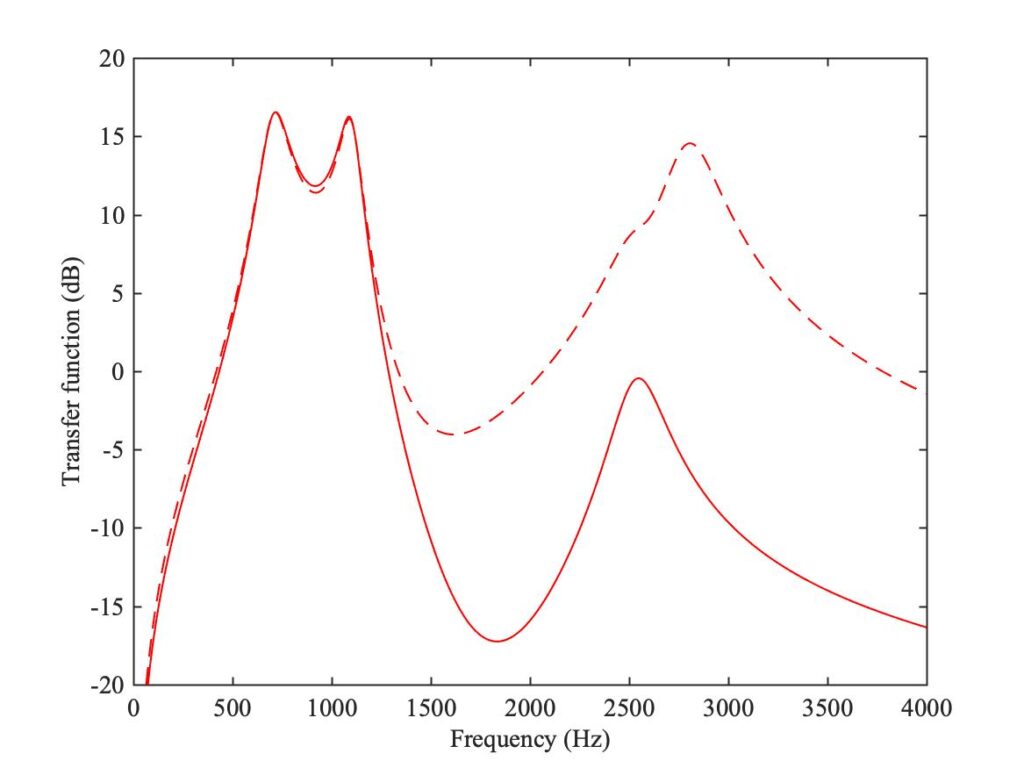
As a simple illustration of the effect of the singer’s formant, Fig. 11 shows the effect of adding an extra peak to the impedance function around 2.8 kHz. The red curve is a repeat of the red curve from Fig. 7, corresponding to the vowel sound in “hard”. The dashed curve shows how this is modified by the extra resonance. Processing the same three “sung” notes as before using these two impedance functions gives Sound 2; a spectrogram of this sound is shown in Fig. 12. A change in tone colour can be clearly heard in the sound, and Fig. 12 shows a boost in level in the range around 3 kHz, qualitatively similar to Sundberg’s observation in Fig. 10.

E. Voice registers and vibration of the vocal folds
Having examined various aspects of vocal tract resonance, it is time to look at the “source” part of the source-filter model — but before that, we should ask whether it is really good enough to separate the two components in this way, or whether the feedback loop from Fig. 3 needs to be closed, as it was for our model of brass instruments.
In the light of what we have learned about resonances of the vocal tract, we can guess what kind of experiment needs to be done to test for significant influence of those resonances on the action of the vocal folds. The strongest coupling will occur when a note is sung with a fundamental frequency falling close to a resonance of the vocal tract (or indeed to a resonance of the chest-lung system, upstream of the vocal folds). So a singer should be asked to explore the range of such a frequency match, either by gliding the pitch with a fixed vowel, or by gliding between vowels at a fixed pitch. If there is significant coupling, we might expect some kind of perturbation or instability to be encountered as the glide passes through the coincident condition.
Experiments like this have been carried out by Titze et al. [7], then revisited with extra ingredients by Wade et al. [8]. In short, their conclusion was that pitch instability was rarely found. This does not mean that there is no effect, but as Wade et al. point out, singers have been exposed to the issue throughout their lives, and so have had plenty of time to learn techniques to cope, and to minimise problems. For the purposes of this simple account of the voice, we can stick with the source-filter model.
In many ways, the vibration of the vocal folds during speech or singing is similar to the vibration of a brass-player’s lips, which we looked at in section 11.5; however, there are also some important contrasts. First, some similarities. Although the anatomical details are different, the two systems are both made of soft tissue, and both have associated muscles that allow the tension and stiffness to be varied so that resonance frequencies can be changed. A high-speed video of vocal fold vibration can be seen here: the other videos linked from that page show alternative methods of visualisation, using a stroboscopic approach. These were all obtained via devices looking down the throat, either inserted in the mouth or through the nose. Both approaches strike me as being quite uncomfortable, and perhaps not conducive to high-quality singing! For comparison, here is a high-speed video showing a trumpeter’s lips in action.
Both videos show complicated three-dimensional motion, but the vocal folds move more dramatically. There is perhaps an impression that the tissue of the vocal folds is more “squidgy” than the lips. This observation is relevant to the next similarity to point out. As we noted back in section 11.5, measurements on lips pressed against a mouthpiece with suitable embouchure have suggested that the relevant lip resonance has very high damping: the Q factor is probably of the order of 1. The same will surely be true of the vocal folds: my guess from the two high-speed videos is that the vocal folds might be more highly damped than the lips. This high damping has important consequences that we will come back to later.
Another similarity between the two systems is that they both require air flow in one direction, not the other. You can’t play a trumpet by sucking rather than blowing, and you can’t sing with normal tone quality while breathing in; you have to be breathing out. Vocal folds, like lips, behave as “blown open” valves, rather than “blown closed” ones like a clarinet reed. Some consequences of that distinction were explored in section 11.5A.
There are also some important differences between the two systems, which we must take into account. The first is a practical matter, already mentioned above: the vocal folds are more inaccessible to any kind of dynamic testing or acoustical measurement. Most of the detailed studies, such as the high-speed video we have just seen, were obtained using methods developed for clinical use in diagnosis of voice disorders. But clinicians are not interested in the damping of vocal fold resonances or in the acoustical impedance immediately above the vocal folds. Their equipment was not designed with this kind of laboratory testing in mind, so we do not have direct measurements of these quantities.
However, we do have estimated versions of the glottal air flow waveform like the idealised example shown in Fig. 4. These can be obtained by measuring the sound pressure at the lips, then compensating for the filtering action of the vocal tract by an inverse filter of some kind. We need not go into the details here: a useful review has been given by Alku [9]. For sung vowels, the resulting waveform always looks somewhat like Fig. 4, with a single pulse of flow in each cycle of vibration, and no flow (or very little flow) for the rest of the cycle. These correspond, of course, to periods when the vocal folds are open or more-or-less closed. The proportion of each cycle for which the folds are open is called the open quotient, and we will see in a moment that this quantity varies widely for different styles of singing.
The next key difference between the voice and a brass instrument will take us into the slightly confusing territory of voice registers. A brass player can utilise many different acoustical resonances of the instrument tube, but they always use the same “mode” of lip vibration. (I will explain later why the word is in quotes here — for the moment I am using the word in a qualitative sense only.) But a singer makes use of more than one “mode” of the vocal folds. If you start near the bottom of your vocal range and then try singing higher and higher notes, there comes a point when you can go no higher using the same singing voice, but you can switch to a falsetto voice and then go higher. There is usually a small range of pitches that a singer can produce in either the normal or falsetto voices, but they will always be well aware of which regime they are using at any given time.
Everyone would agree that the transition to falsetto is a switch to a different voice register. However, that term is used rather differently by voice scientists and singing teachers — both for their own good reasons. (See Henrich [10] for a useful overview of everything about voice registers.) The scientific usage is confined to regimes that involve some fundamental difference in the way the vocal folds vibrate. The two that I have been calling “normal voice” and “falsetto” are the most commonly-used registers, but there are two others. At the lowest frequencies is a register responsible for the “gravelly” voice of some speakers. It is sometimes called the “vocal fry” or “strohbass” register, and some singers can use it to produce extremely low pitches — Sound 3 gives an example, in the context of Tuvan throat singing. At the opposite extreme, above the regular falsetto range is another transition to what is sometimes known as the “whistle”, “flageolet” or “bell” register.
These four registers are thought to be associated with different mechanisms of vocal fold vibration, labelled “M1” for normal voice, “M2” for falsetto, “M0” for the vocal fry register, and “M3” for the whistle register. One way in which these registers differ is in their open quotient, which in turn influences the frequency spectrum of the sound — a small value of the open quotient signifies short pulses in the air flow waveform and a very rich spectrum, while a value approaching 1 could lead to an almost-sinusoidal waveform that is weak in higher harmonics. The open quotient can be small for mechanism M0, is typically around 0.5 for M1, then it is progressively bigger for M2 and M3.
However, a singing teacher is not really interested in the physics behind voice production. Their job is to help a pupil to get the best sound quality across their vocal range, and to be able to control that sound quality for musical expressivity. For this purpose they often use a richer language of “voice registers” to distinguish singing regimes that feel different to the singer, whether that feeling is mainly associated with a mechanism in the larynx, or with manipulation of the vocal tract, or with a combination of the two. Two familiar terms are “head voice” and “chest voice”, descriptive of how it should feel to the singer when they do it right. In terms of physics, these terms have different meanings for male and female singers. According to the review by Henrich [10], male chest and head voices are both produced using mechanism M1, whereas a female singer uses M1 for chest voice and M2 for head voice. Other terms for vocal registers in this sense are sometimes used: for example “belting”, “modal voice”, “loft”, and “voix mixte”. That last term refers to techniques used to smooth the transition between registers based on mechanisms M1 and M2, presumably involving manipulation of the vocal tract “filter” to minimise the tonal jump when the M1/M2 switch is made.
To return to physics… The naive singer’s transition from normal voice to falsetto definitely feels like a jump, rather than something that can be done by a continuous change. Rapid switching between these two voice registers is what a yodeller exploits. Each switch involves a pitch jump, and has the character of a nonlinear regime transition somewhat similar to what happens when you overblow a note on a recorder and it abruptly jumps up an octave. However, there is an important difference between the two. On the recorder, the two regimes are mainly governed by the resonances of the tube: the air-jet excitation mechanism stays more or less the same. With the voice, the transition is mainly to do with the behaviour of the vocal folds: as we have already said, the “tube”, your vocal tract, has very little to do with the pitch of a sung note.
Notice that on this issue, a brass instrument appears to show some aspects of both behaviours. When a bugle player jumps to the next note in their harmonic series, they are making use of the next resonance of the tube — but they also have to tighten their embouchure to raise the lip resonance frequency to the vicinity of the new note. Recall plots like Fig. 16 of section 11.5, reproduced here as Fig. 13. It shows that in order to produce the succession of notes (shown by different colours) the player has to change their lip resonance frequency (as well as being careful about their blowing pressure). But a regime jump is always firmly based on the resonance properties of the tube, whereas with the voice it is not.

So what is the physical basis for the different voice registers? There has been some research on this question, but there is not yet a fully convincing answer. Exactly what a singer does to create a jump to falsetto, for example, is far from clear. They can’t be using the same “mode” of the vocal folds by simply raising its frequency using muscle tension: remember that the falsetto transition was necessary precisely because you couldn’t sing any higher in your normal voice.
I have been rather loosely describing mechanisms M1 and M2 as being based on different “modes” of the vocal folds, but what does this really mean? One obvious possibility is that they are indeed based around different vibration modes of the vocal folds. That description would fit neatly with the pitch jumps that a yodeller produces: the mode for M2 would have a higher resonance frequency than the mode for M1. A more complicated possibility has also been put forward, by Zhang and others (see e.g. [11]). On the basis of a simplified model, they found that as the velocity of the air-jet from the lungs increases, two of the vibration resonance frequencies of the folds approach and collide, producing a bifurcation. Emerging from this bifurcation is an unstable branch, and once the growth rate from this instability is big enough to counteract the damping, self-excited vibration would begin. Perhaps a voice register jump involves a different coincidence of modes and a different resulting bifurcation? At the present, we simply don’t know.
However, there is a snag with all existing modelling which might change the perspective and the conclusions. We have already noted that resonances of the vocal folds are likely to have extremely high damping: Q-factors of 1 or even less. Under those circumstances, all simple approaches to modelling become distinctly dubious. As was discussed at the end of section 11.5 in the context of brass-players’ lip vibration, there are two consequences of very high damping.
The first is that “modes” may not exist at all! There is no universal model for damping in mechanical systems. Computational methods like the Finite Element Method usually assume a mathematically-convenient model called “viscous damping”, in which case (as Rayleigh showed [12]), the mathematical concept of a mode is still OK. But real systems rarely (if ever) conform to the assumption of viscous damping, and for a more general damping model the concept of a mode has only been justified for the case when the damping is assumed to be small [13]. So we simply don’t know whether “modes” make sense for vibration of the flesh making up the vocal folds.
Even if the use of modes can be justified, there is a second snag. For the cases that can be analysed, it is universally found that for a highly-damped system like this, the mode shapes become complex. This means that significant phase differences should be expected between different aspects of the motion. Figure 14 shows a repeat of an animation shown back in section 11.1, of vocal folds vibrating in mechanism M1. There is wave-like motion (known in the anatomical literature as the “mucosal wave”) as the folds first meet at the bottom, then the contact region moves upwards.
One description of this motion would be as a single complex mode shape: the wave behaviour arises from phase differences at different positions on the folds. This wave motion could be a direct consequence of high damping, rather than necessitating a complicated interaction between two modes leading to a bifurcation. This possibility could be explored by the kind of simple approach we used for lip vibration, where a similar phase difference had been found to be important for predicting the onset of a note on a brass instrument (see section 11.5). In the case of brass, when our model was extended to include the phase difference it was then able to predict lip vibration with a Q-factor as low as 1. It seems a reasonable guess that something similar might occur in the context of the voice, but this is a task for future research.
F. Birdsong
As a coda to this section on the human voice, I will dip briefly into birdsong. Many musicians have been fascinated by the musical qualities of some birdsong. Mozart kept a pet starling and notated some of its singing, while Messaien was a bit of a birdsong obsessive: he filled several notebooks with notated material, and explicitly based some of his compositions on birdsong. Sound 4 gives a good example of how this fascination could arise: it is the song of a Musician wren, recorded in Ecuador. The name is self-explanatory — there is an obvious melodic feel to this song.
However, this is a rather unusual example because the musical quality is immediately apparent to us. For most birdsong we are not able to grasp what the bird is doing in the same immediate way, for a very simple reason. Smaller animals tend to do everything at a faster pace than larger ones, so the song of a small bird is usually too compressed for human ears. Sound 5 illustrates this. It is a short extract from a recording of a common European blackbird, a familiar sound to anyone from the U.K.
Now listen to Sound 6, which is the same extract slowed down by a factor of 4 (and so reduced in pitch by 2 octaves). This slower version reveals an extraordinary complexity which was not apparent (to my ears, at least) in the original version. No doubt, this complexity would be fully appreciated by a female blackbird! Figure 15 shows a spectrogram of the sound, which reveals something of the structure behind the complexity. Try following the spectrogram as you listen to the slowed-down sound (remembering that time runs upwards from the bottom in this version of a spectrogram plot). The time and frequency scales here relate to the original sound, but of course the pattern is the same for the slowed-down version. Spectrograms are often used in the study of birdsong, because they can reveal such a lot of detail in the sound.
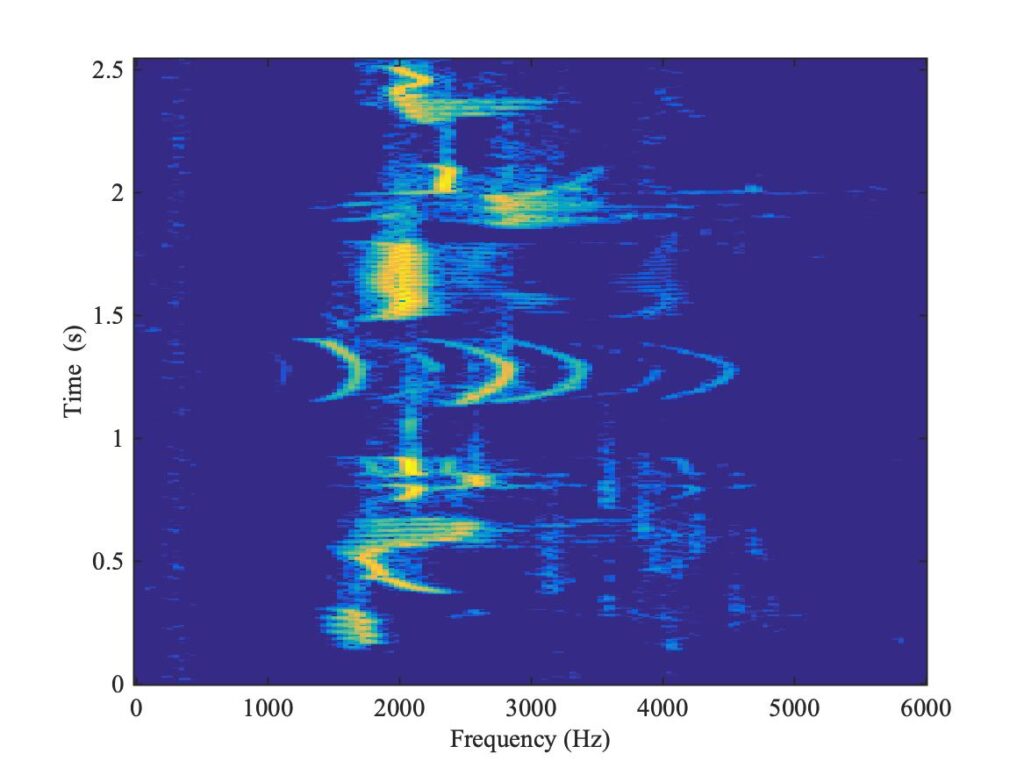
Sounds 7 and 8 give similar real-time and slowed-down recordings of another bird, this time a South African bird called a short-clawed lark. You might not immediately notice anything peculiar about this song, but look carefully at the spectrogram in Fig. 16. In the region just below the middle of this plot, you can see two lines of bright colour which cross. The short-clawed lark was singing two notes at the same time: one note was gliding upwards in frequency, while the other was gliding downwards. Now you know what to listen for, you can probably hear this in the slowed-down Sound 8.
To understand how it is possible for a bird to sing two notes at the same time, we need to look at a crucial feature of the anatomy of a typical songbird. Figure 17 shows a schematic diagram. Birds have a trachea (windpipe), broadly similar to humans. But they do not make sounds using vocal folds in the larynx at the top of the trachea; instead, they have an organ called the syrinx, near where the trachea divides in two to connect with the lungs. The details vary among different kinds of birds, but for the songbirds we are interested in the important part of the syrinx lies just below this junction.
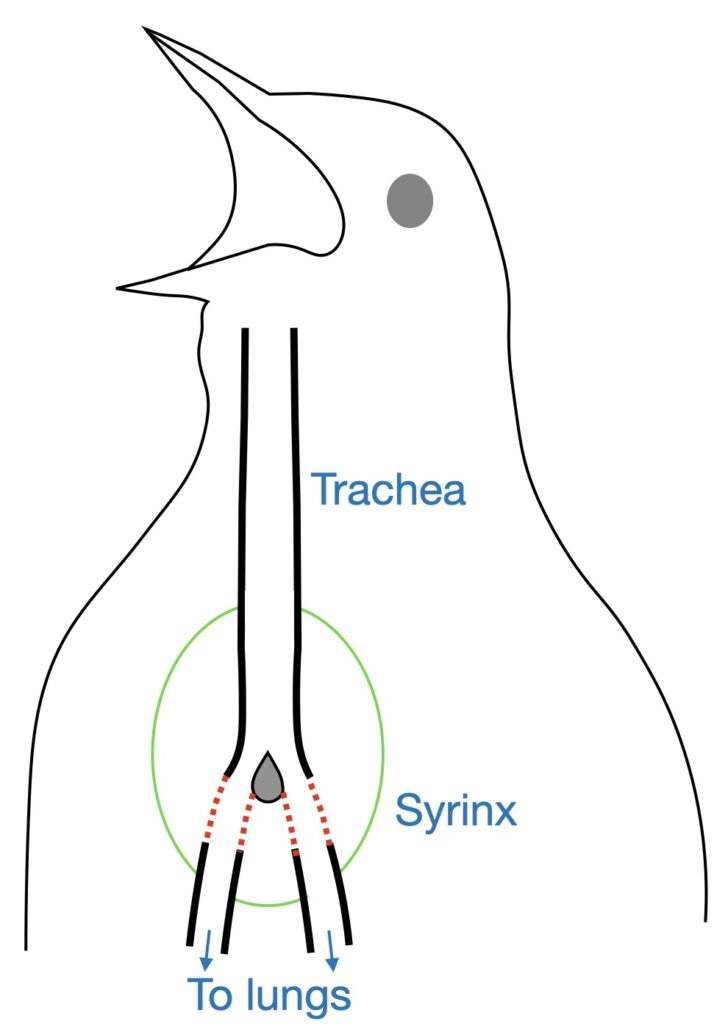
Along most of their length these various tubes have stiffening rings around their circumference, but in the region indicated by dotted red lines the tube walls are thin, flexible membranes. This region is surrounded by an air cavity indicated by the green oval, which the bird can pressurise during song. This pressure pushes the flexible membranes inwards so they protrude into the tubes. There are also several muscles in this region, which can modify the resonance properties of the membranes. The result is somewhat similar to our vocal folds: the air flow from the lungs encounters an adjustable constriction formed of soft tissue, with one or more resonance frequencies that can be controlled by the bird.
At the onset of song, these constrictions in the syrinx start oscillating. This modulates the air flow and provides an acoustical source — very similar to the motion of human vocal folds. But unlike humans, songbirds have two acoustical sources rather than a single one. The musculature allows these to be controlled separately, and this is the reason our short-clawed lark was able to sing two notes at the same time, and control them both independently. For more examples of how birds take advantage of the versatility of the syrinx to do vocal gymnastics, see the website of the Cornell Lab Bird Academy: https://academy.allaboutbirds.org/birdsong/.
Biologists have done a lot of research into the detailed anatomy of birds of all kinds, and into behavioural aspects of their use of song and other sounds. However, there has been relatively little work to explore the physical and acoustical mechanisms behind birdsong. An important pioneer in this area was someone we have met before in this chapter: Neville Fletcher did important work on a wide range of musical wind instruments, and he also collaborated with biologists in some fundamental studies into the physics of birdsong. I will summarise some of his findings.
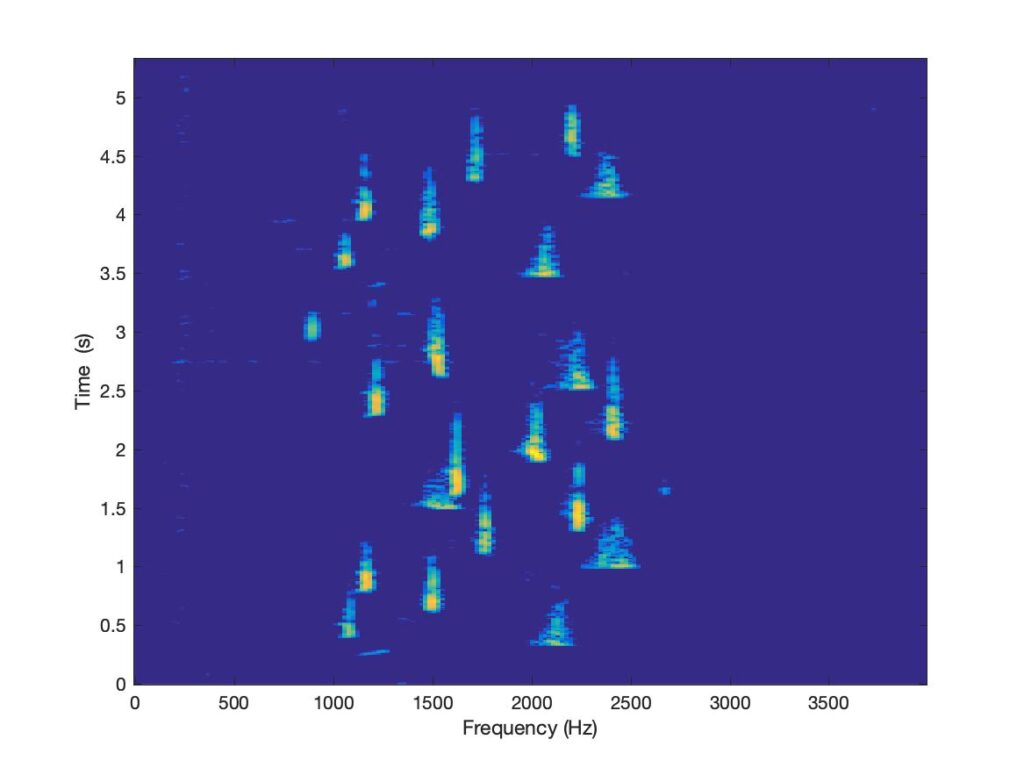
The first of these will give an interesting link to our earlier discussion of what sopranos do with their vocal tracts when they sing high notes. It had been noted that some elements of birdsong seem to be remarkably close to pure tones, with very little in the way of higher harmonics present. Figure 18 shows an example: this is a spectrogram of a short extract from Sound 4, the Musician wren. It shows short, intense bursts of sound with no sign of glides between notes, and no sign (at this plot resolution) of harmonic content above each fundamental frequency. (The second harmonic would show up as another blob at the same horizontal level, twice the distance from the left-hand edge.)
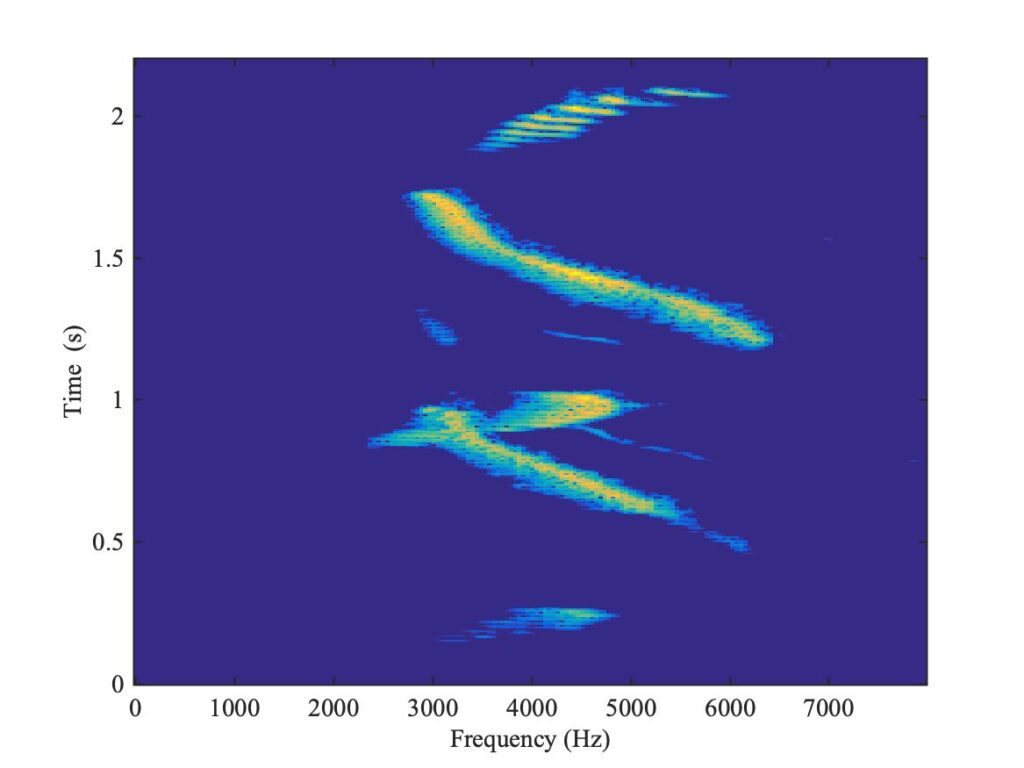
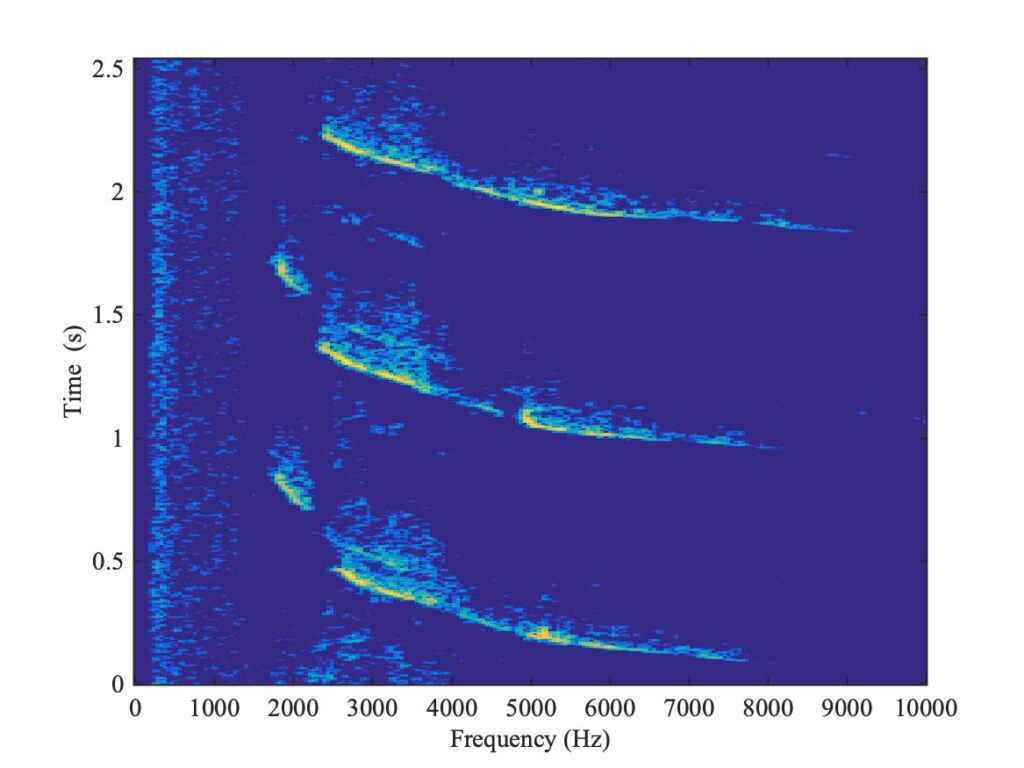
Fletcher’s study of the phenomenon concentrated on another bird, the Northern cardinal from North America. A short extract of this bird’s song is given in Sound 9, with a slowed-down version in Sound 10. The spectrogram is shown in Fig. 19. The most conspicuous features in this plot are curving lines, indicating tones that fall (over a remarkably wide range). These falling tones are very obvious in Sound 10. Notice, incidentally, that the lower two curving lines have a “shadow” above them, a roughly parallel fainter line that bursts into bright colour at a relatively low frequency around 2 kHz. Probably, these shadow lines are being produced by sounds from the other side of the syrinx from those responsible for the main line: they overlap in time with the main line, so the two notes are sometimes simultaneous.
Fletcher considered but discarded the possibility that these “pure-tone songs” were being produced by a whistle-like mechanism that might have produced an intrinsically pure tone. Instead, he and his collaborators showed that the effect was being produced by a resonance coinciding with the fundamental frequency [15, 16]. As shown schematically in Fig. 20, the Northern cardinal has a resonating cavity adjacent to the vocal tract. This cavity is formed by a distended portion of the esophagus, leading to the bird’s stomach.
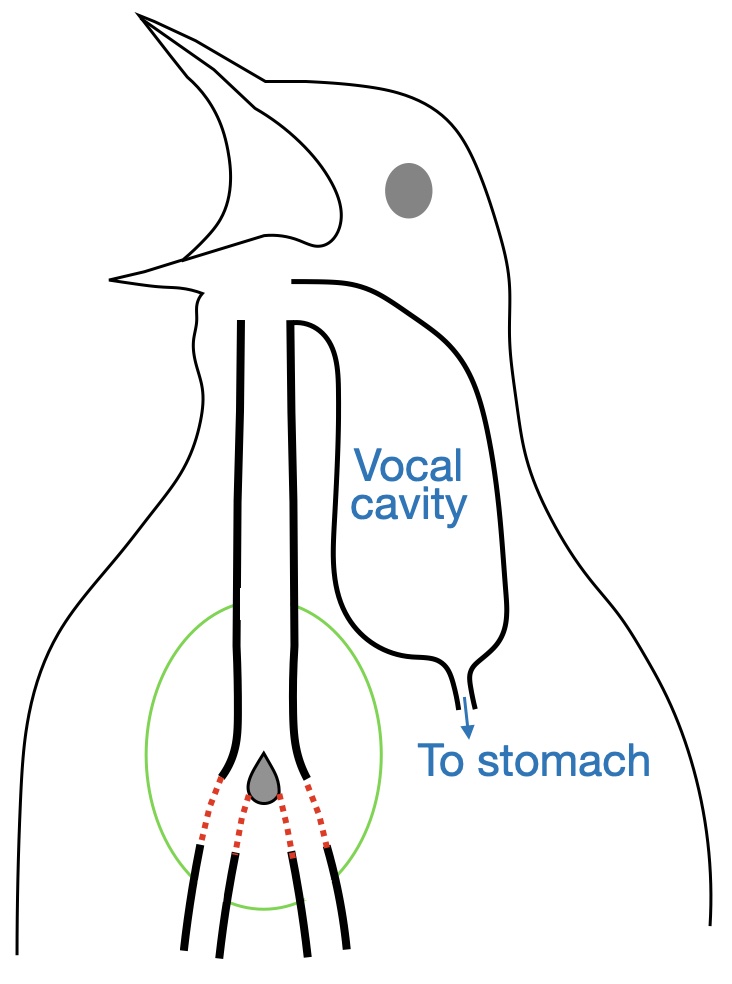
The bird inflates the cavity to a volume that can be controlled by the air pressure, and it then acts as a Helmholtz resonator near the top of the vocal tract. Remarkably, they were able to show that the bird adjusts the frequency of this Helmholtz resonator so that it accurately tracks the fundamental frequency of each falling tone — very similar to the way that a soprano will adjust the frequency of a vocal tract resonance to track the fundamental of high notes. The resonance enhances the loudness of the fundamental frequency, accounting for the low levels of higher harmonics.
Fletcher and his collaborators also looked at a related question. This mechanism for the sound of a Northern cardinal’s song relies on the fact that the bird sings with its beak open. The “coo” of a dove is also close to a pure tone, but this time the bird produces the sound with its beak closed. The group showed that a very similar physical mechanism is responsible, but the sound source is different [17]. The dove also has a distensible air sac that can act as an acoustic resonator, but instead of being entirely inside the body, it is on the surface of the bird’s breast. The wall of the sac is thin and flexible, and when the Helmholtz resonance is activated by the dove making a sound with the same fundamental frequency, the volume of the sac pulsates at the resonance frequency. It thus forms a monopole sound source, and the “coo” is radiated from there rather than from the bird’s mouth.
The dove is not the only bird to make sound using an inflatable pouch. Not exactly a “song”, but here you can see the extraordinary appearance and sound of a displaying male sage grouse.
[1] Ingo R. Titze: “Sensitivity of odd-harmonic amplitudes to open quotient and skewing quotient in glottal airflow (L)”; Journal of the Acoustical Society of America 137, 502–504 (2015).
[2] Peter Ladefoged and Keith A. Johnson: “A course in phonetics”. Wadsworth (2011).
[3] Elodie Joliveau, John Smith and Joe Wolfe: “Tuning of vocal tract resonance by sopranos”, Nature 427, 116 (January 2004).
[4] Maëve Garnier, Natalie Henrich, John Smith and Joe Wolfe: “Vocal tract adjustments in the high soprano range” Journal of the Acoustical Society of America 127, 3771-3780. (2010)
[5] Johan Sundberg: “The science of the singing voice”, Northern Illinois University Press (1987)
[6] Johan Sundberg: “The singer’s formant revisited”, Voice 4, 106-119 (1995). The same text is also available here.
[7] I. R. Titze, T. Riede and P. Popolo; “Nonlinear source-filter coupling in phonation: Vocal exercises,” Journal of the Acoustical Society of America 123, 1902–1915 (2008).
[8] Laura Wade, Noel Hanna, John Smith and Joe Wolfe; “The role of vocal tract and subglottal resonances in producing vocal instabilities”, Journal of the Acoustical Society of America 141, 1546–1559 (2017).
[9] Paavo Alku; “Glottal inverse filtering analysis of human voice production — A review of estimation and parameterization methods of the glottal excitation and their applications”, Sadhana 36, 5, 623—650 (2011)
[10] Nathalie Henrich; “Mirroring the voice from Garcia to the present day: Some insights into singing voice registers”, Logopedics Phoniatrics Vocology, 31, 1, 3–14 (2006)
[11] Zhaoyan Zhang; “Mechanics of human voice production and control”, Journal of the Acoustical Society of America 140, 2614-2635, (2016).
[12] J. W. S. Rayleigh: “The Theory of Sound” (1877, reprinted by Dover, New York 1945)
[13] J. Woodhouse; “Linear damping models for structural vibration”, Journal of Sound and Vibration 215, 547–569 (1998).
[14] Franz Goller; “The syrinx”, Current Biology 32, R1042—R1172 (2022), https://www.cell.com/current-biology/fulltext/S0960-9822%2822%2901311-2
[15] Tobias Riede, Roderick A. Suthers, Neville H. Fletcher and William E. Blevins; “Songbirds tune their vocal tract to the fundamental frequency of their song”, Proceedings of the National Academy of Science, 103, 5543—5548 (2006)
[16] Neville H. Fletcher, Tobias Riede and Roderick A. Suthers; “Model for vocalization by a bird with distensible vocal cavity and open beak”, Journal of the Acoustical Society of America 119, 1005—1011 (2006).
[17] Neville H. Fletcher, Tobias Riede, Gabriel J. L. Beckers and Roderick A. Suthers; “Vocal tract filtering and the ‘’coo’’ of doves”, Journal of the Acoustical Society of America 116, 3750—3756 (2006).