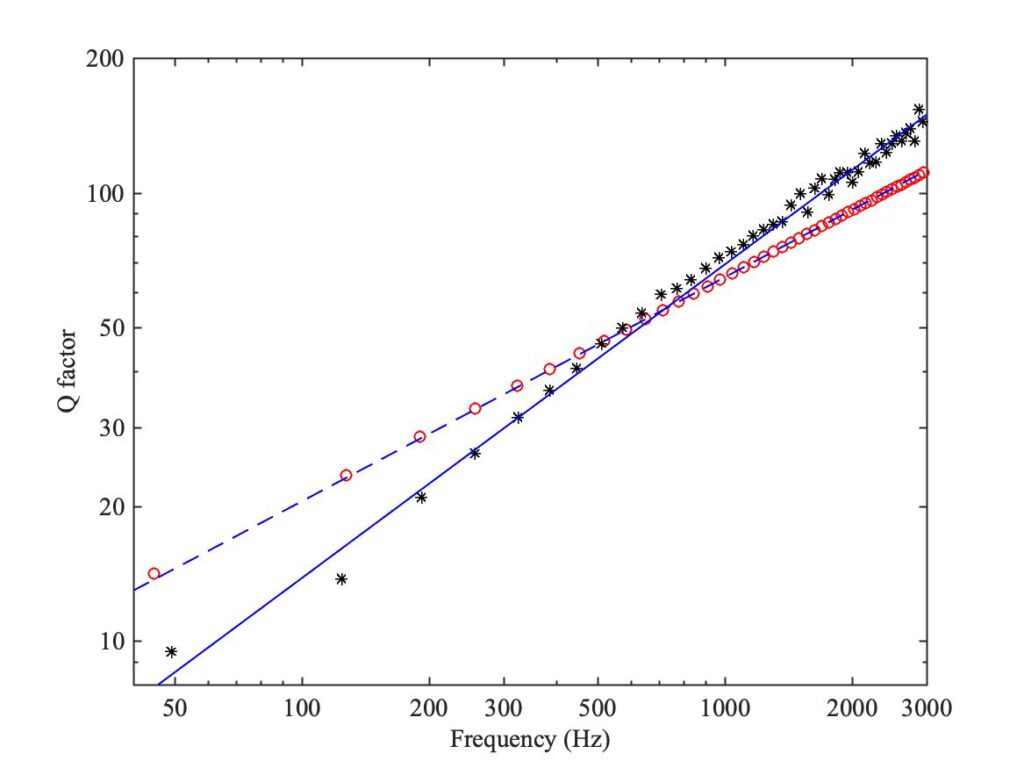
The measured input impedance of a trombone without its mouthpiece, shown in the blue curve of Fig. 6 in section 11.5, gives modal fits that reveal something interesting about the usual model for energy dissipation of plane sound waves in tubes. The measured Q-factors are plotted against frequency using black stars in Fig. 1, on a log-log scale. The red circles show modal fits to the synthesised impedance (shown in the red curve of Fig. 6 of section 11.5). That synthesis model used modal Q-factors based on the usual formula for boundary dissipation in cylindrical tubes that are not extremely narrow, described in section 11.1.1 and frequently cited in the standard literature on brass and woodwind instruments, for example Fletcher and Rossing [1] and Campbell, Gilbert and Myers [2].

The damping model is usually stated in terms of a spatial decay rate, so a first step is to convert that into a temporal decay rate, which in turn can be translated into a Q-factor. The argument used in this work runs as follows. The damping model gives the spatial variation of a harmonic signal at frequency $\omega$ as
$$e^{i\omega x/c-\alpha x} \tag{1}$$
where
$$\alpha \approx 1.2 \times 10^{-5} \sqrt{\omega}/a, \tag{2}$$
$c$ is the speed of sound and $a$ is the radius of the tube. On the other hand, in a free decay of a mode with frequency $\omega_n$ and Q-factor $Q_n$, the temporal variation is proportional to
$$e^{i \omega_n t -\omega_n t/Q_n} . \tag{3}$$
If we now assume that the frequency-wavenumber relation $k=\omega/c$ continues to hold for this complex frequency and complex wavenumber, we find
$$Q_n \approx \frac{\omega_n}{2 \alpha c} . \tag{4}$$
The Q-factors indicated by the red circles, based on this damping model, are always well within a factor of 2 of the corresponding measured results, and ordinarily this would be regarded as excellent agreement for any predictive model of damping. But in fact the plot suggests that this theory may be missing something, because it does not predict the correct trend with frequency. The measured results show a clear and orderly pattern, which roughly follows a power law, but the power is more like 0.7 (indicated by the solid blue line) than the value 0.5 arising from the square root in equation (2) (shown by the dashed blue line). However, some doubt has been cast on the calibration accuracy of this particular measured impedance, so pending confirmation of that we should not worry too much about the discrepancy.
[1] Neville H Fletcher and Thomas D Rossing; “The physics of musical instruments”, Springer-Verlag (Second edition 1998)
[2] Murray Campbell, Joël Gilbert and Arnold Myers, “The science of brass instruments”, ASA Press/Springer (2021)
